Hybrid Machine Learning
Improving the spatial prediction of soil salinity in arid regions using wavelet transformation and support vector regression models
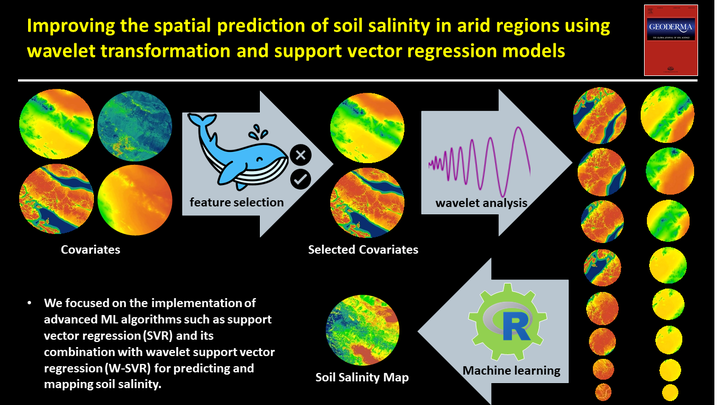
Table of Contents
Video Abstract
Motivation
Although different ML models have been used in DSM, to the best of our knowledge, there has yet to be a study that maps soil salinity using methods that combine wavelet transformation and ML techniques. Therefore, the objective of this study was to predict and map the spatial distribution of soil salinity at a high resolution in central Iran using ML algorithms and a large number of environmental covariates. We focused on the implementation of advanced ML algorithms such as support vector regression (SVR) and its combination with wavelet support vector regression (W-SVR) for predicting and mapping soil salinity. In addition, we evaluated the uncertainty of the ML algorithms using the UNEEC method.
Methods
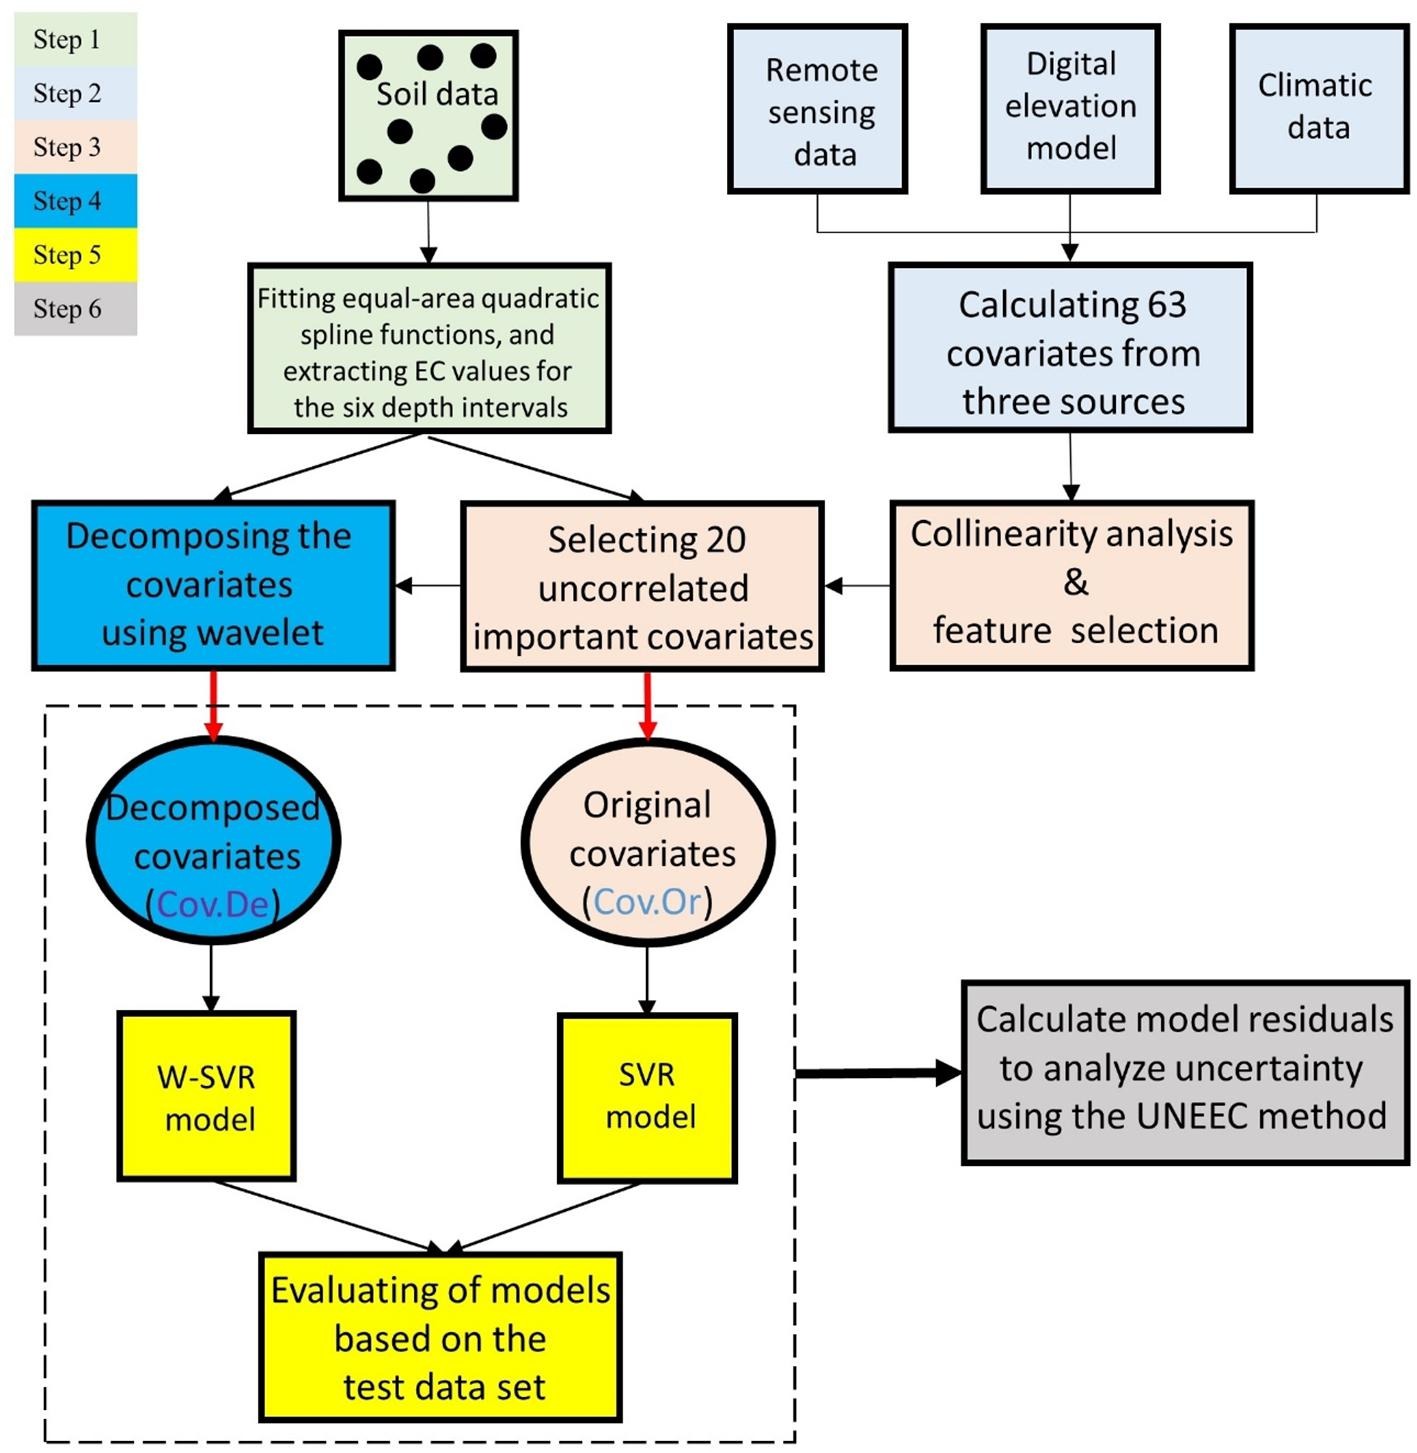
The workflow used to carry out this study is summarized in the figure.
Environmental covariates
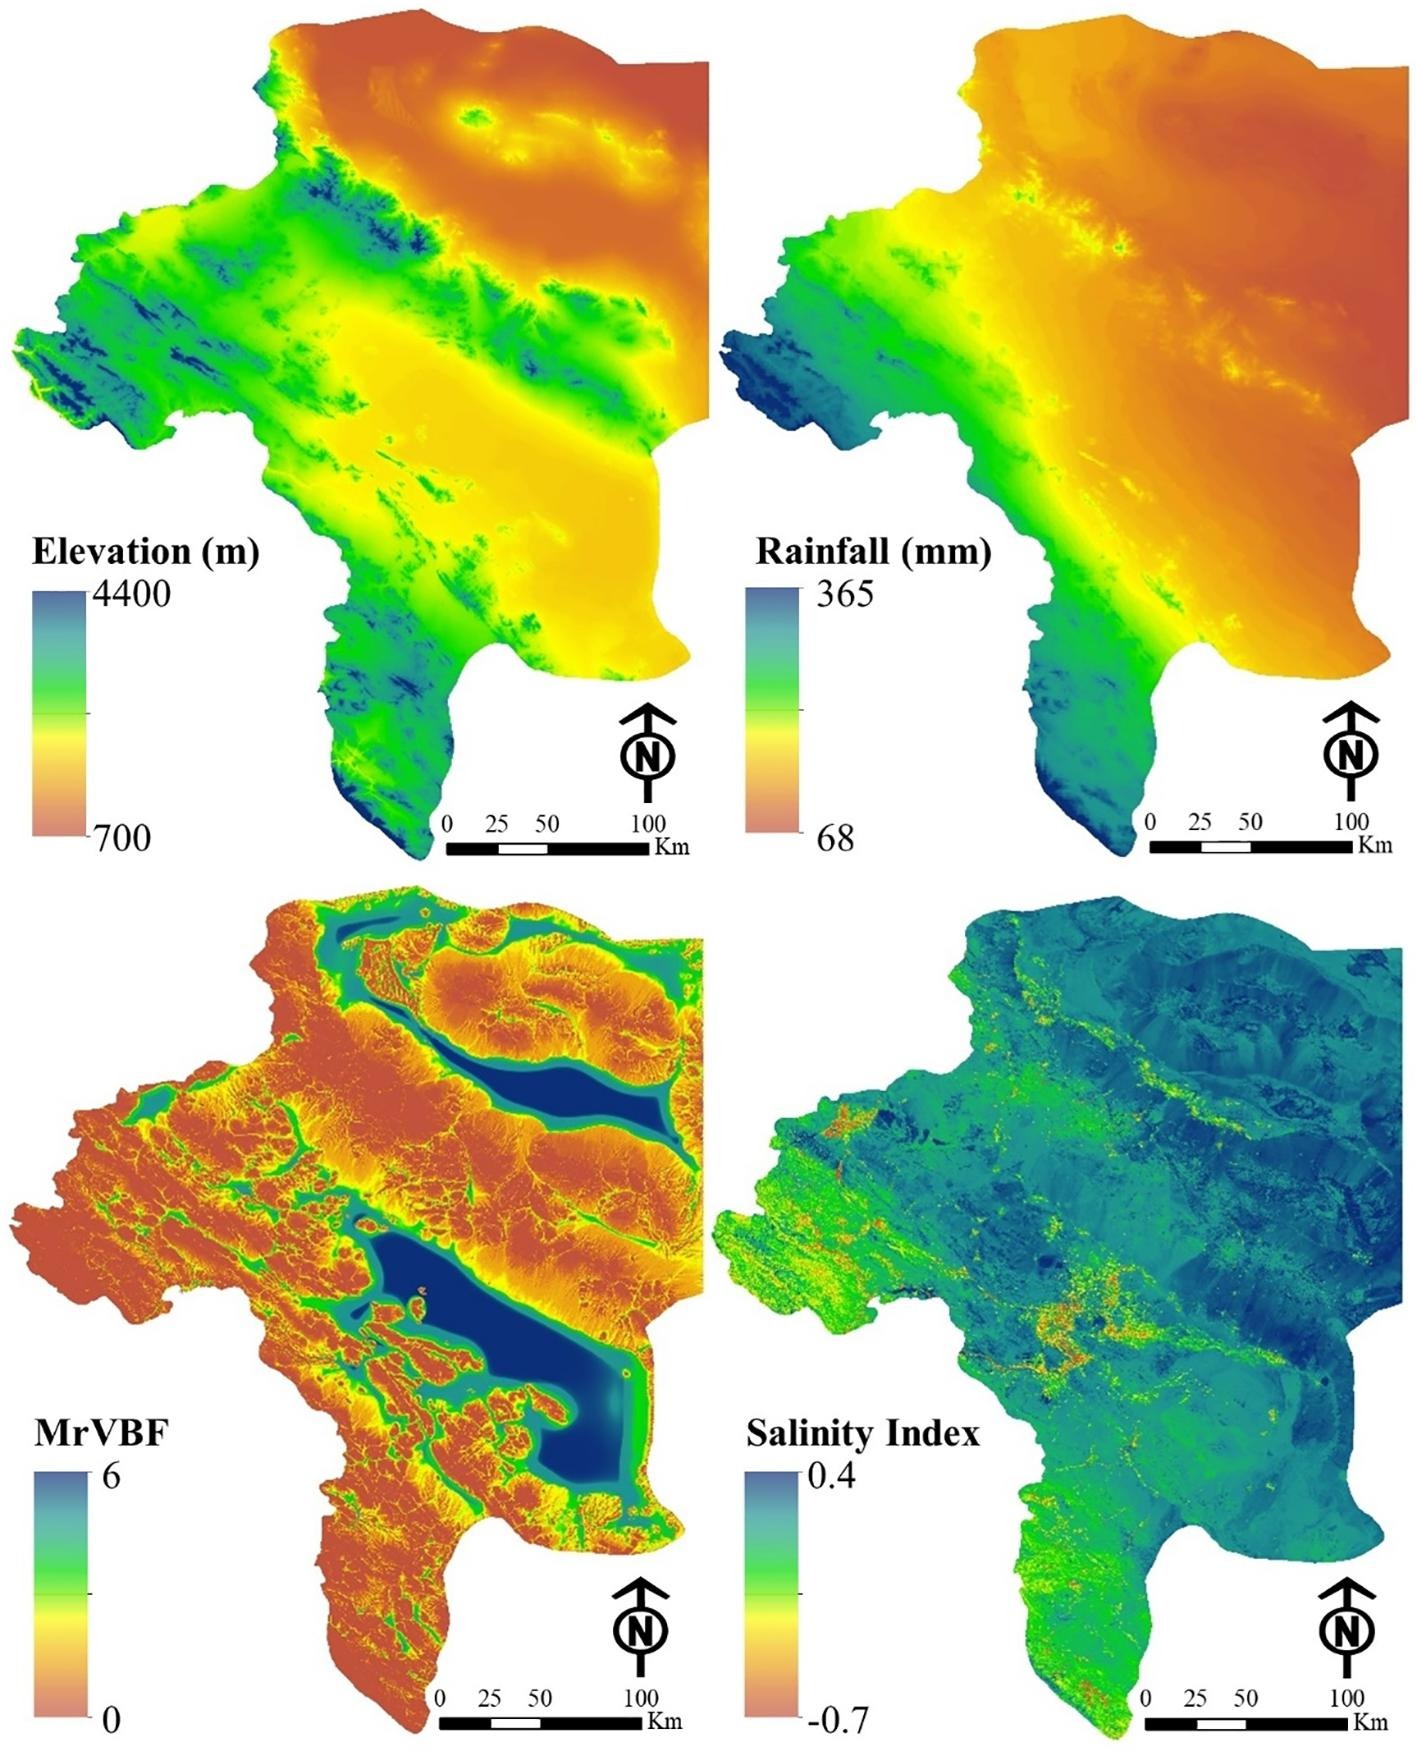
The environmental covariates were derived from remote sensing data, digital elevation data, and climatic data were used in this study.
Whale optimization algorithm
Theoretically, the whales use the bubble-net attacking mechanism in order to swim near the prey (i.e., small fishes). WOA is a relatively new swarm-based metaheuristic optimization technique that mimics this intelligent behavior of whales. WOA involves two phases including exploitation (i.e. encircling a prey/ bubble-net attacking method), and exploration (i.e. searching the prey).
Wavelet transformation
Wavelet transformation is a multi-resolution data analysis approach for data processing to extract the frequency information. Wavelet transformation shares similarities with the short-time, Fourier transformation from the perspective that time series are decomposed into the shifted and scaled forms of the wavelet.
Support vector regression
SVR was used to model the complex relationships between EC values for the six depth increments and a suite of covariates representing the topography, climate, and vegetation of the study area.
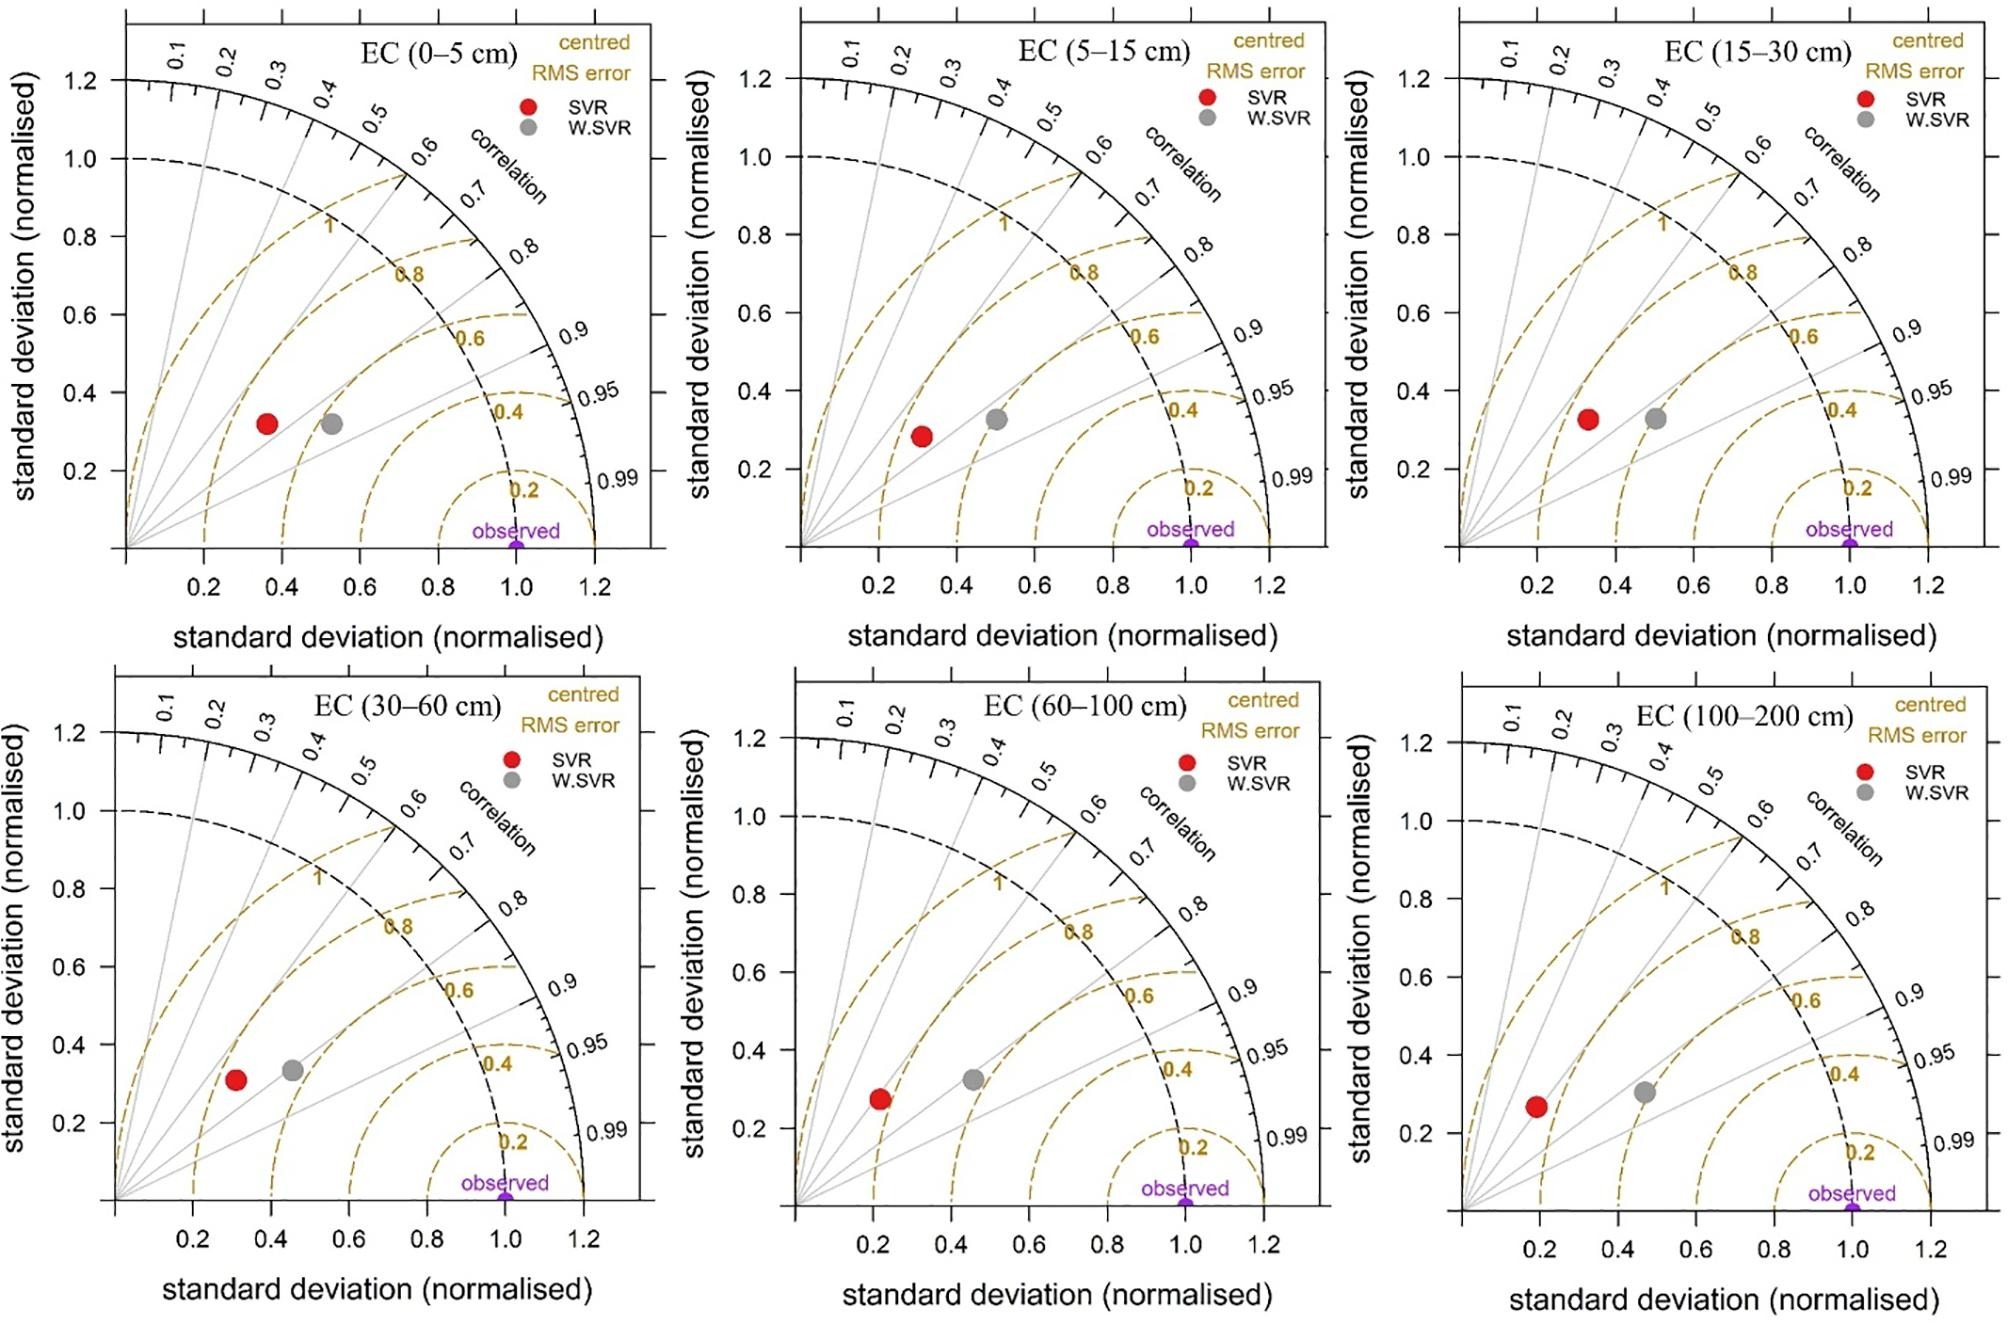
Taylor diagrams
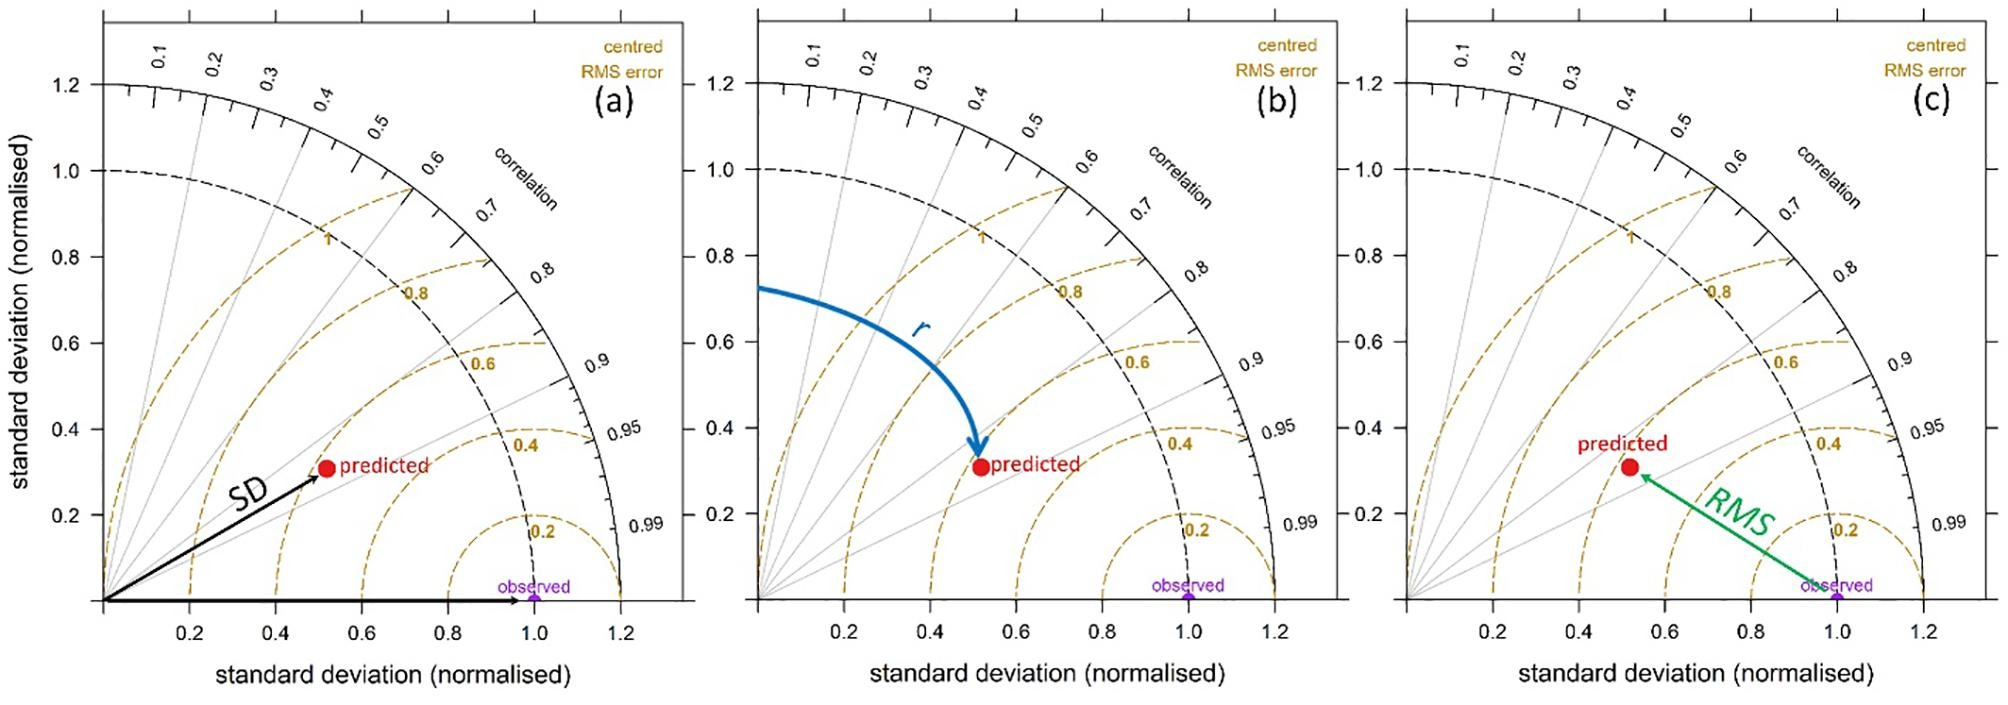
Taylor diagrams (TD) are mathematical diagrams designed to graphically facilitate the comparative assessment of different models based on three model performance statistics: the correlation coefficient, the centered root mean square (RMS) difference, and the standard deviation.
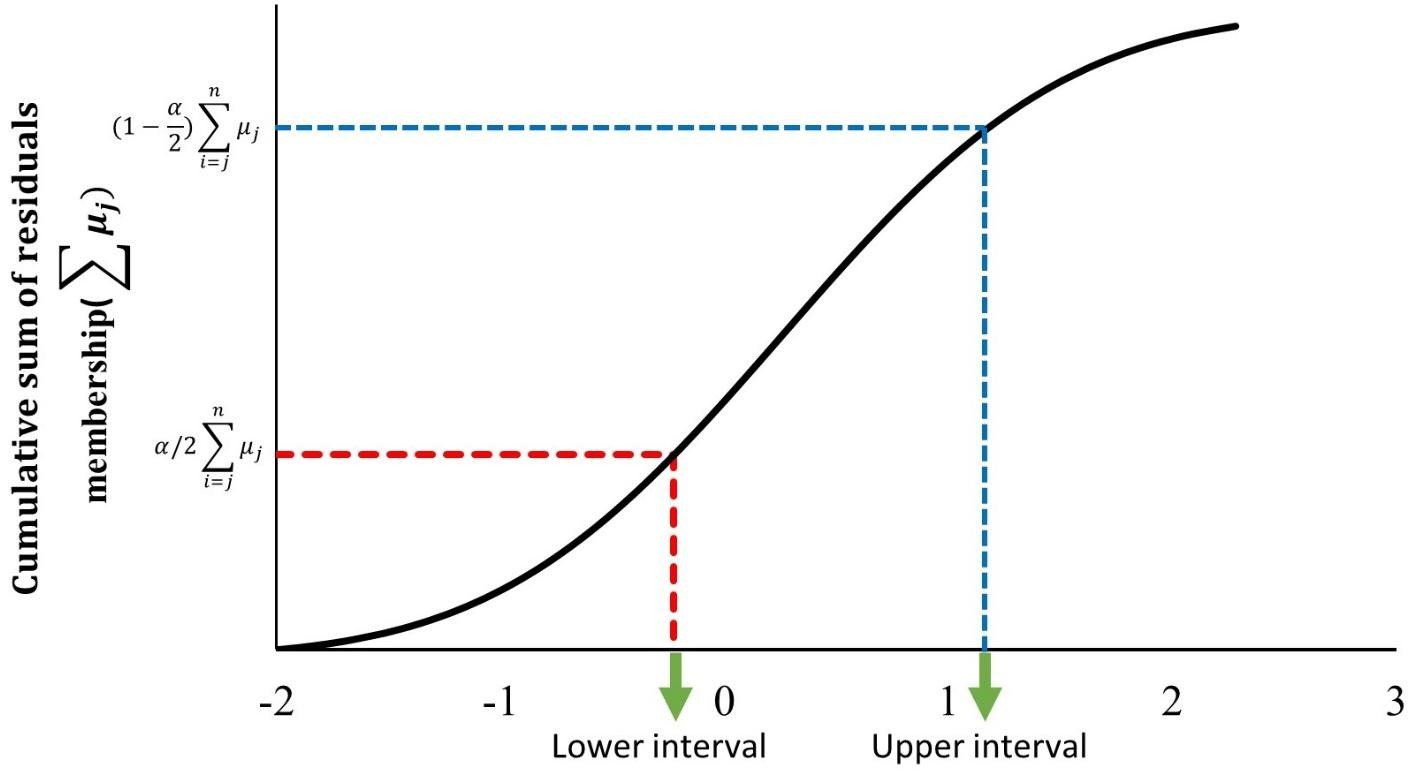
Uncertainty analysis using UNEEC method
The UNEEC method consists of four steps: calculating residuals, clustering, estimation of the residuals probability distribution for clusters, and estimating various quantiles of residuals for each sample.
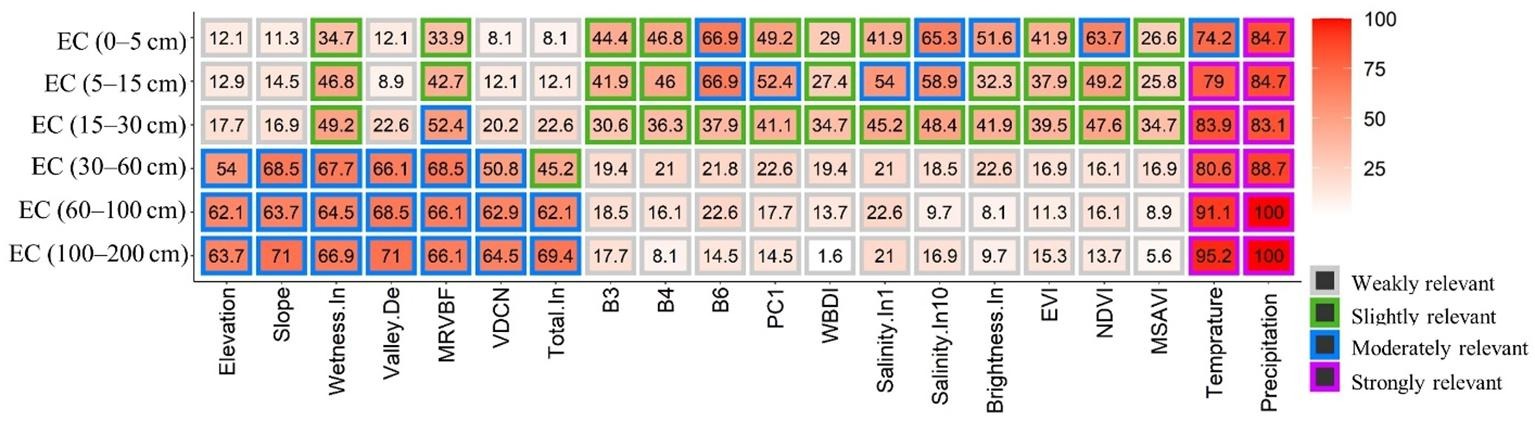
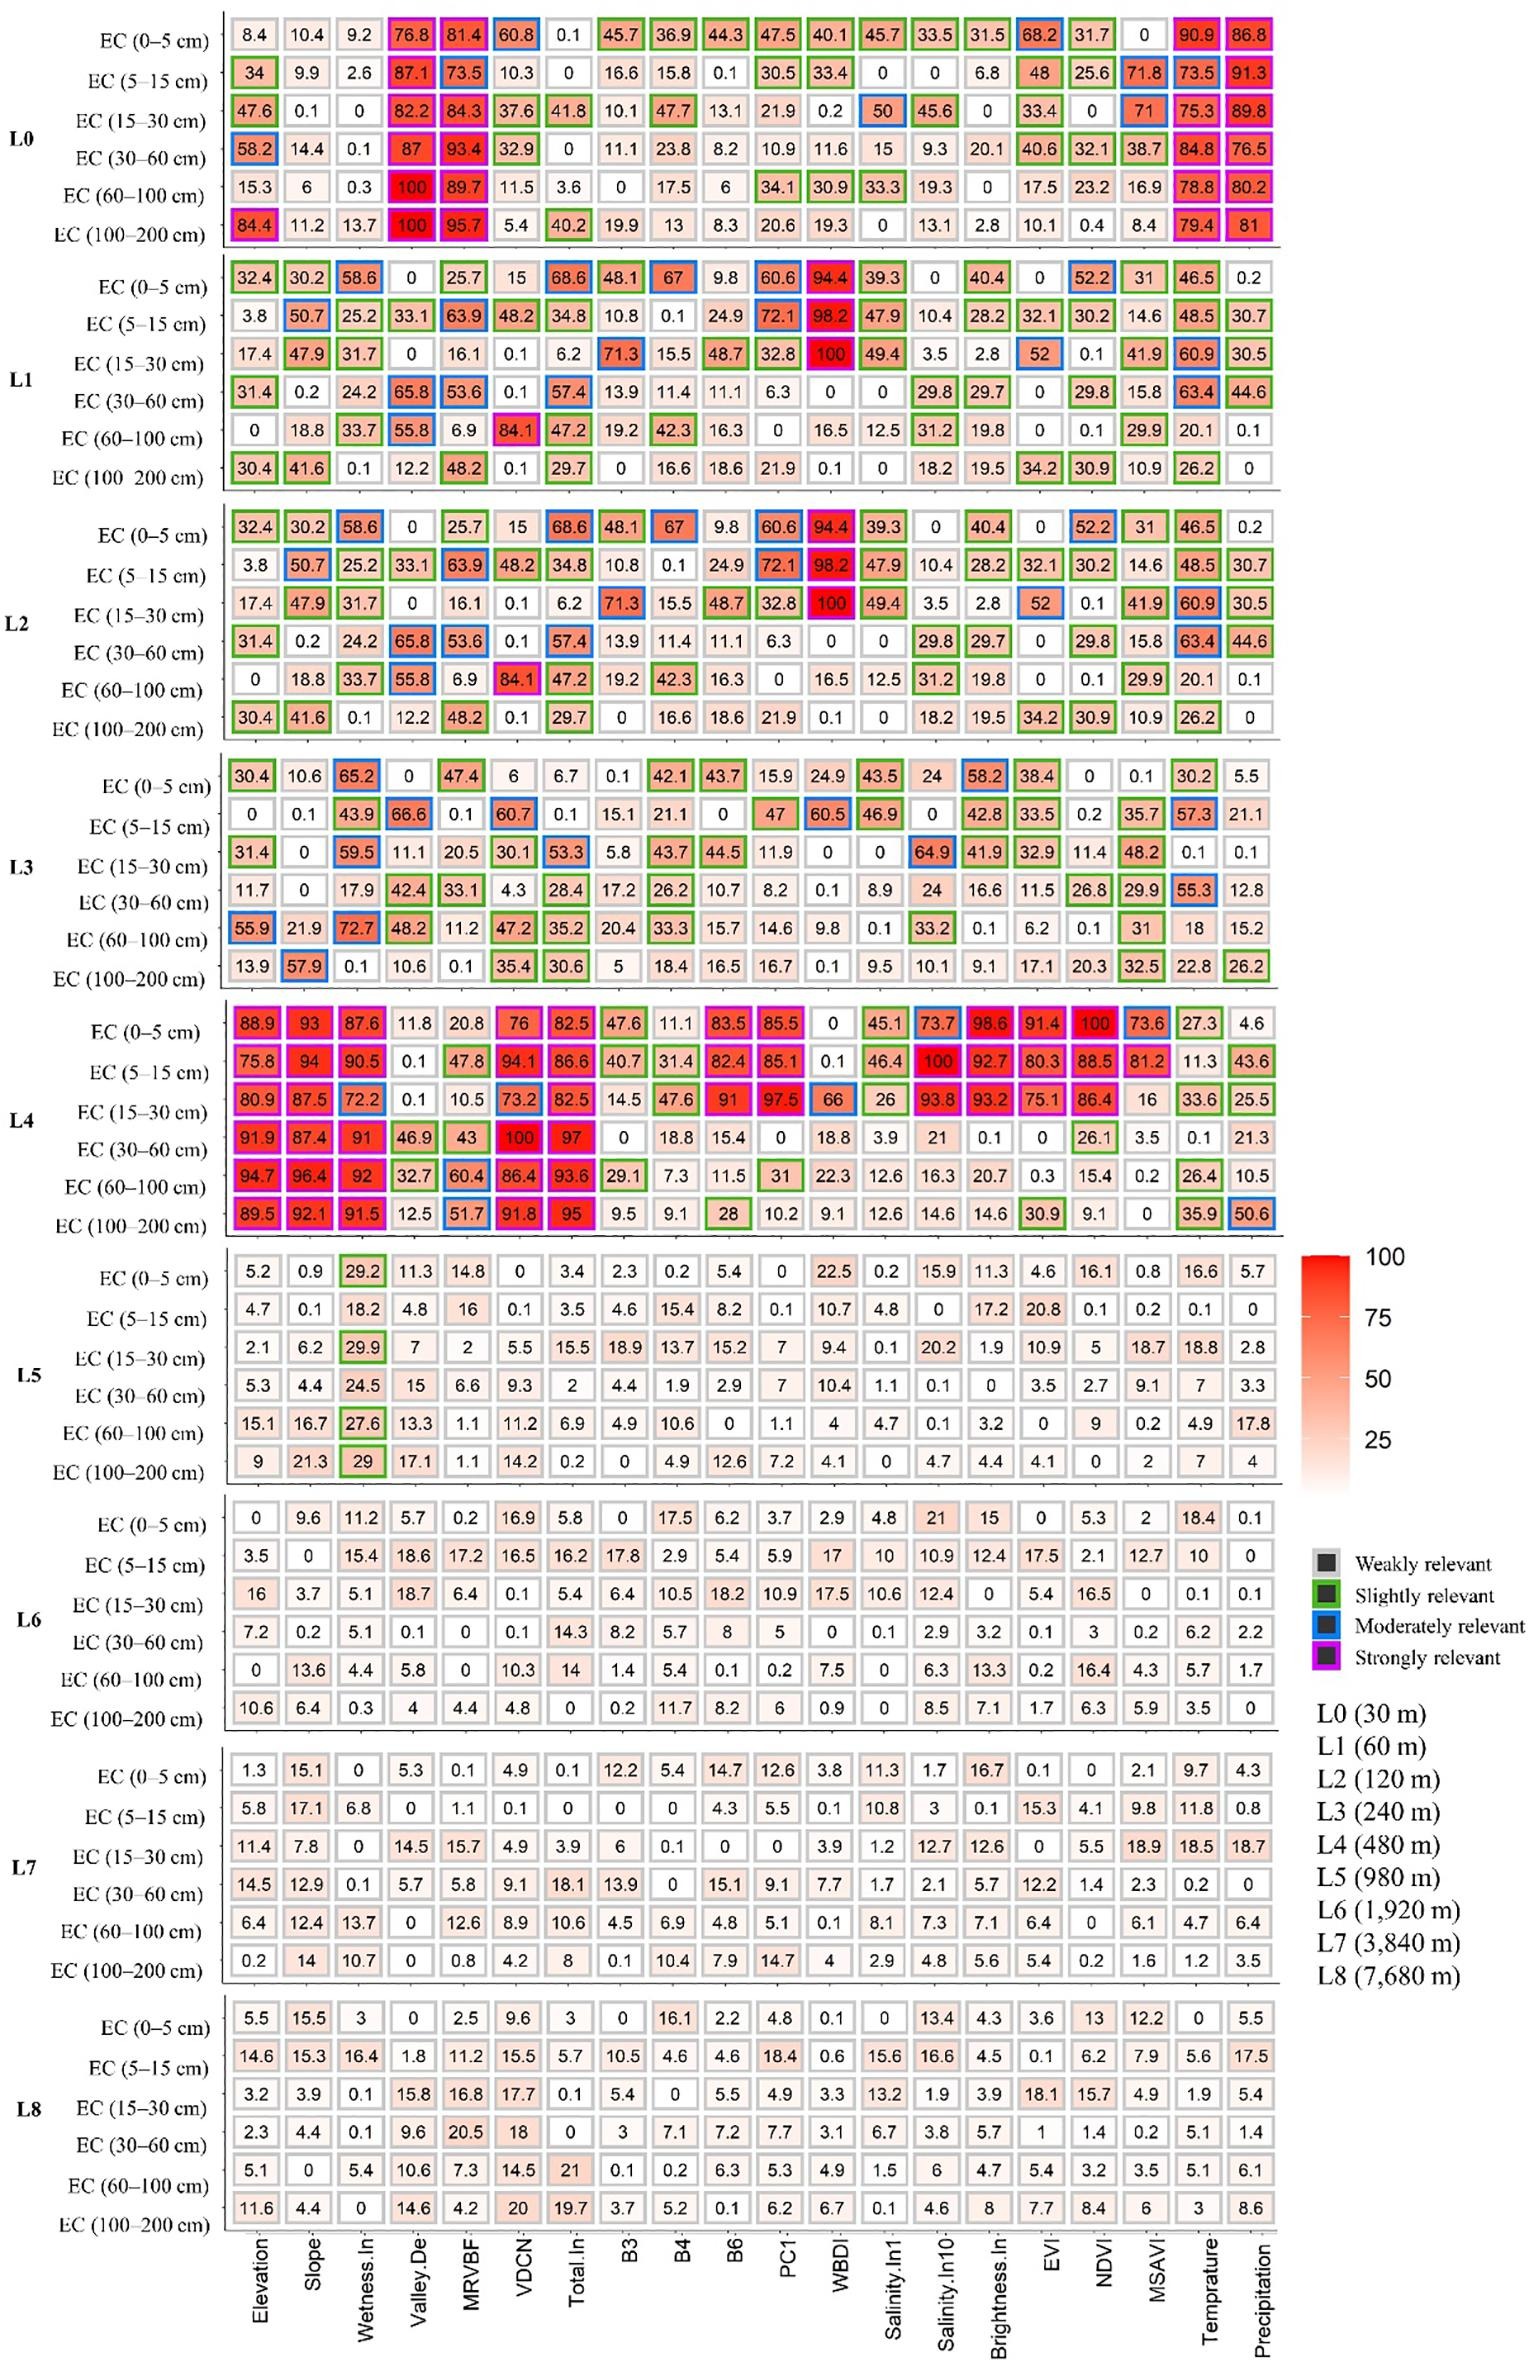
Covariate importance analysis
The importance of the original and decomposed covariates (Cov.Or and Cov.De) for predicting soil salinity using SVR and W-SVR models is presented in figures, respectively. Values representing covariate importance can range from 0 to 100 and the intensity of colors, from light to dark, represent the importance of each covariate on the soil salinity prediction.
Performances of SVR and W-SVR models
Figure displays the TDs for both models and for all depth increments, where the space from the reference purple point represents the magnitude of the centered root mean squared error.
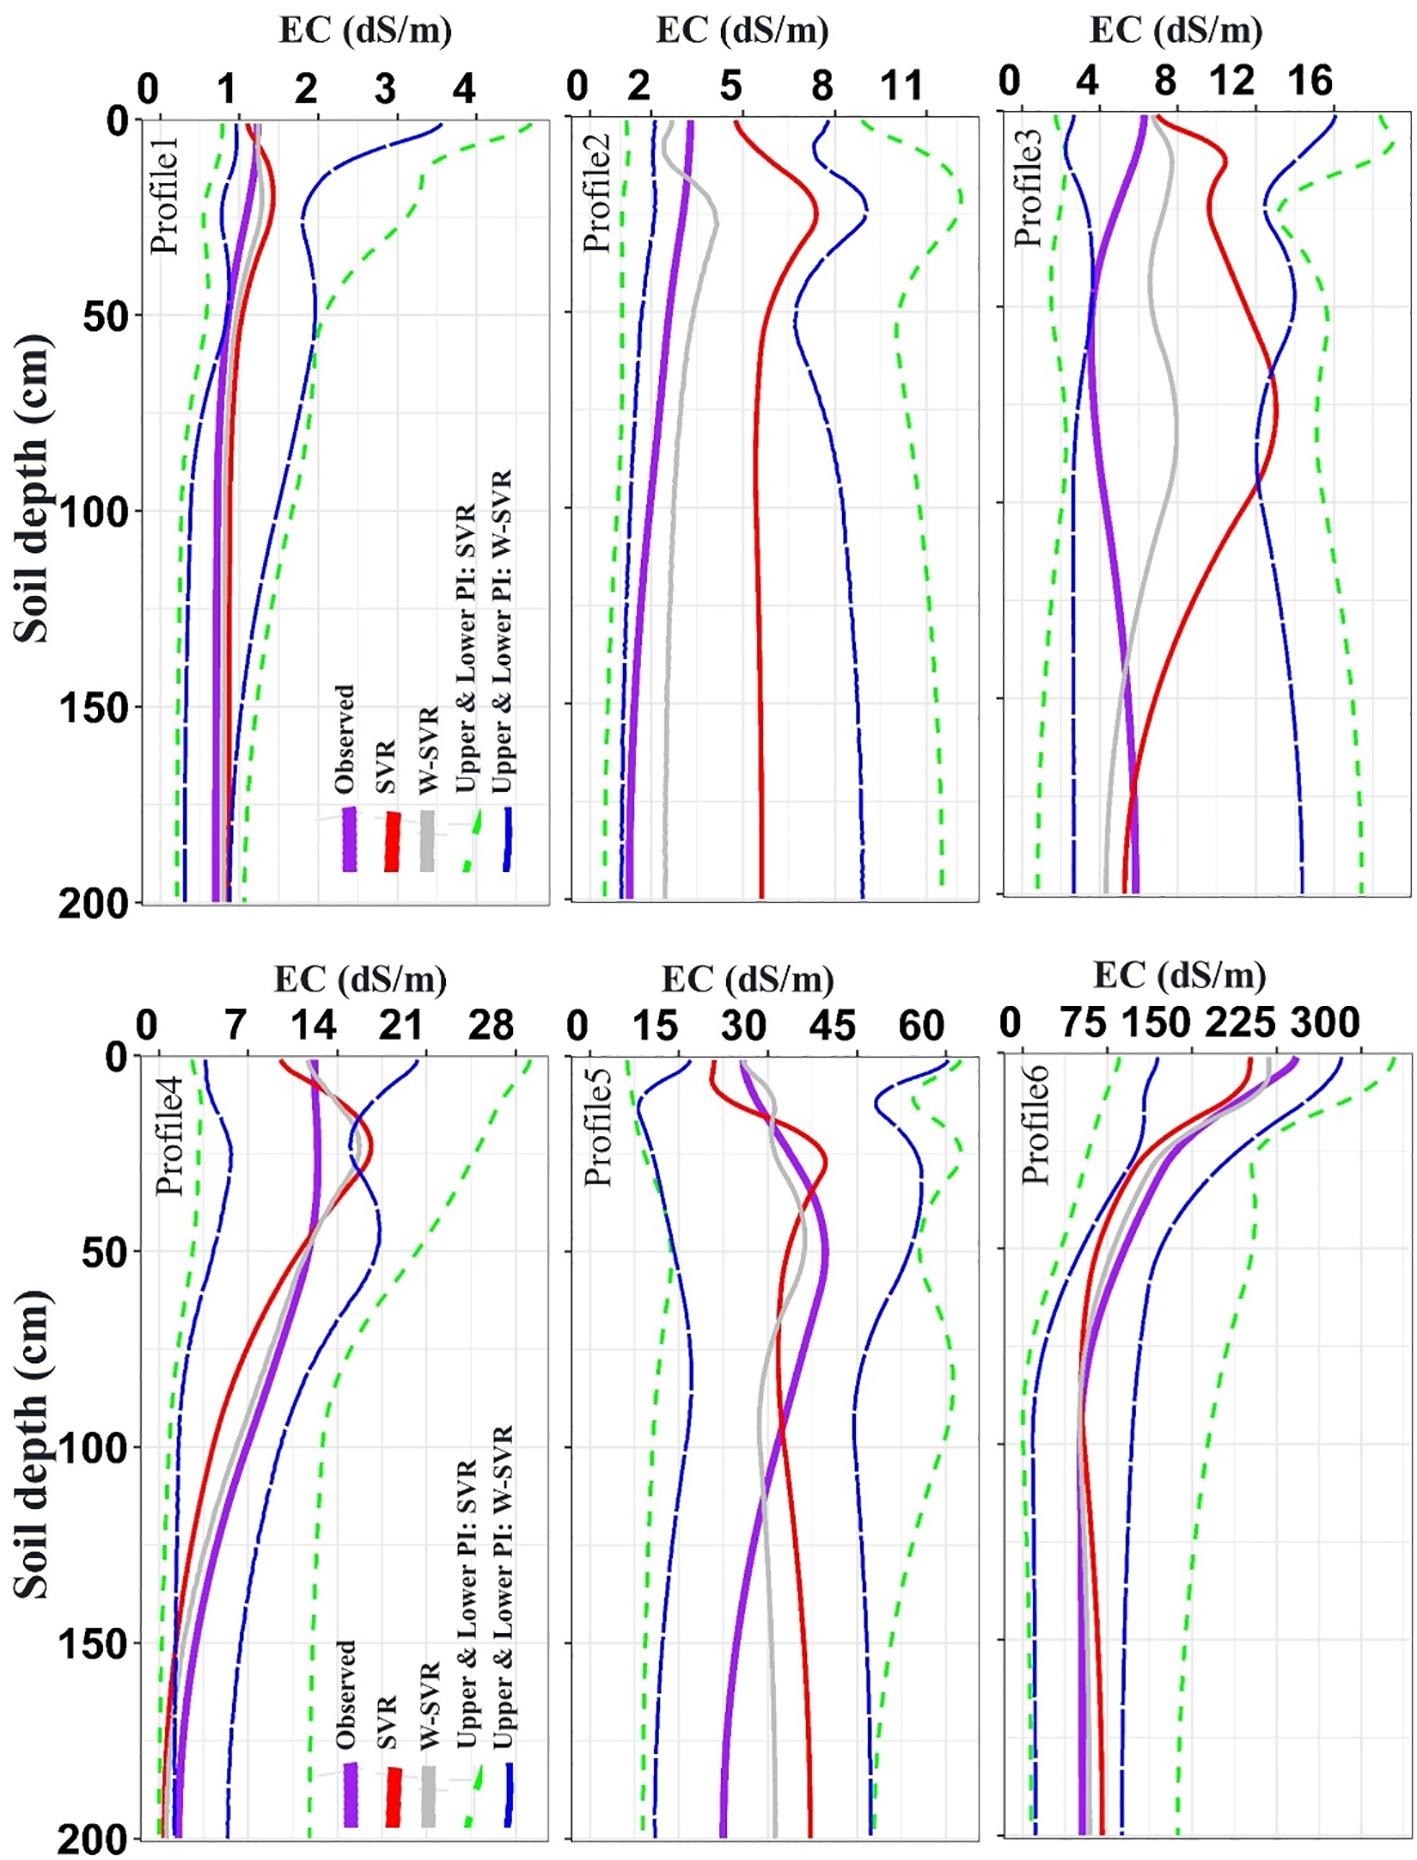
We plotted the variation of the observed and predicted values as well as the prediction intervals for EC from up as a depth function for SVR and W-SVR. Here, we selected six profiles from non-saline soils (EC < 2 dS/m) to extremely saline soils (EC > 250 dS/m) in order to explore the accuracy and uncertainty of the two models. From the six soil profiles, it can be easily inferred that W-SVR model was much more effective in predicting soil salinity compared to SVR by reducing the uncertainty in the predictions.
Spatial distribution of soil salinity
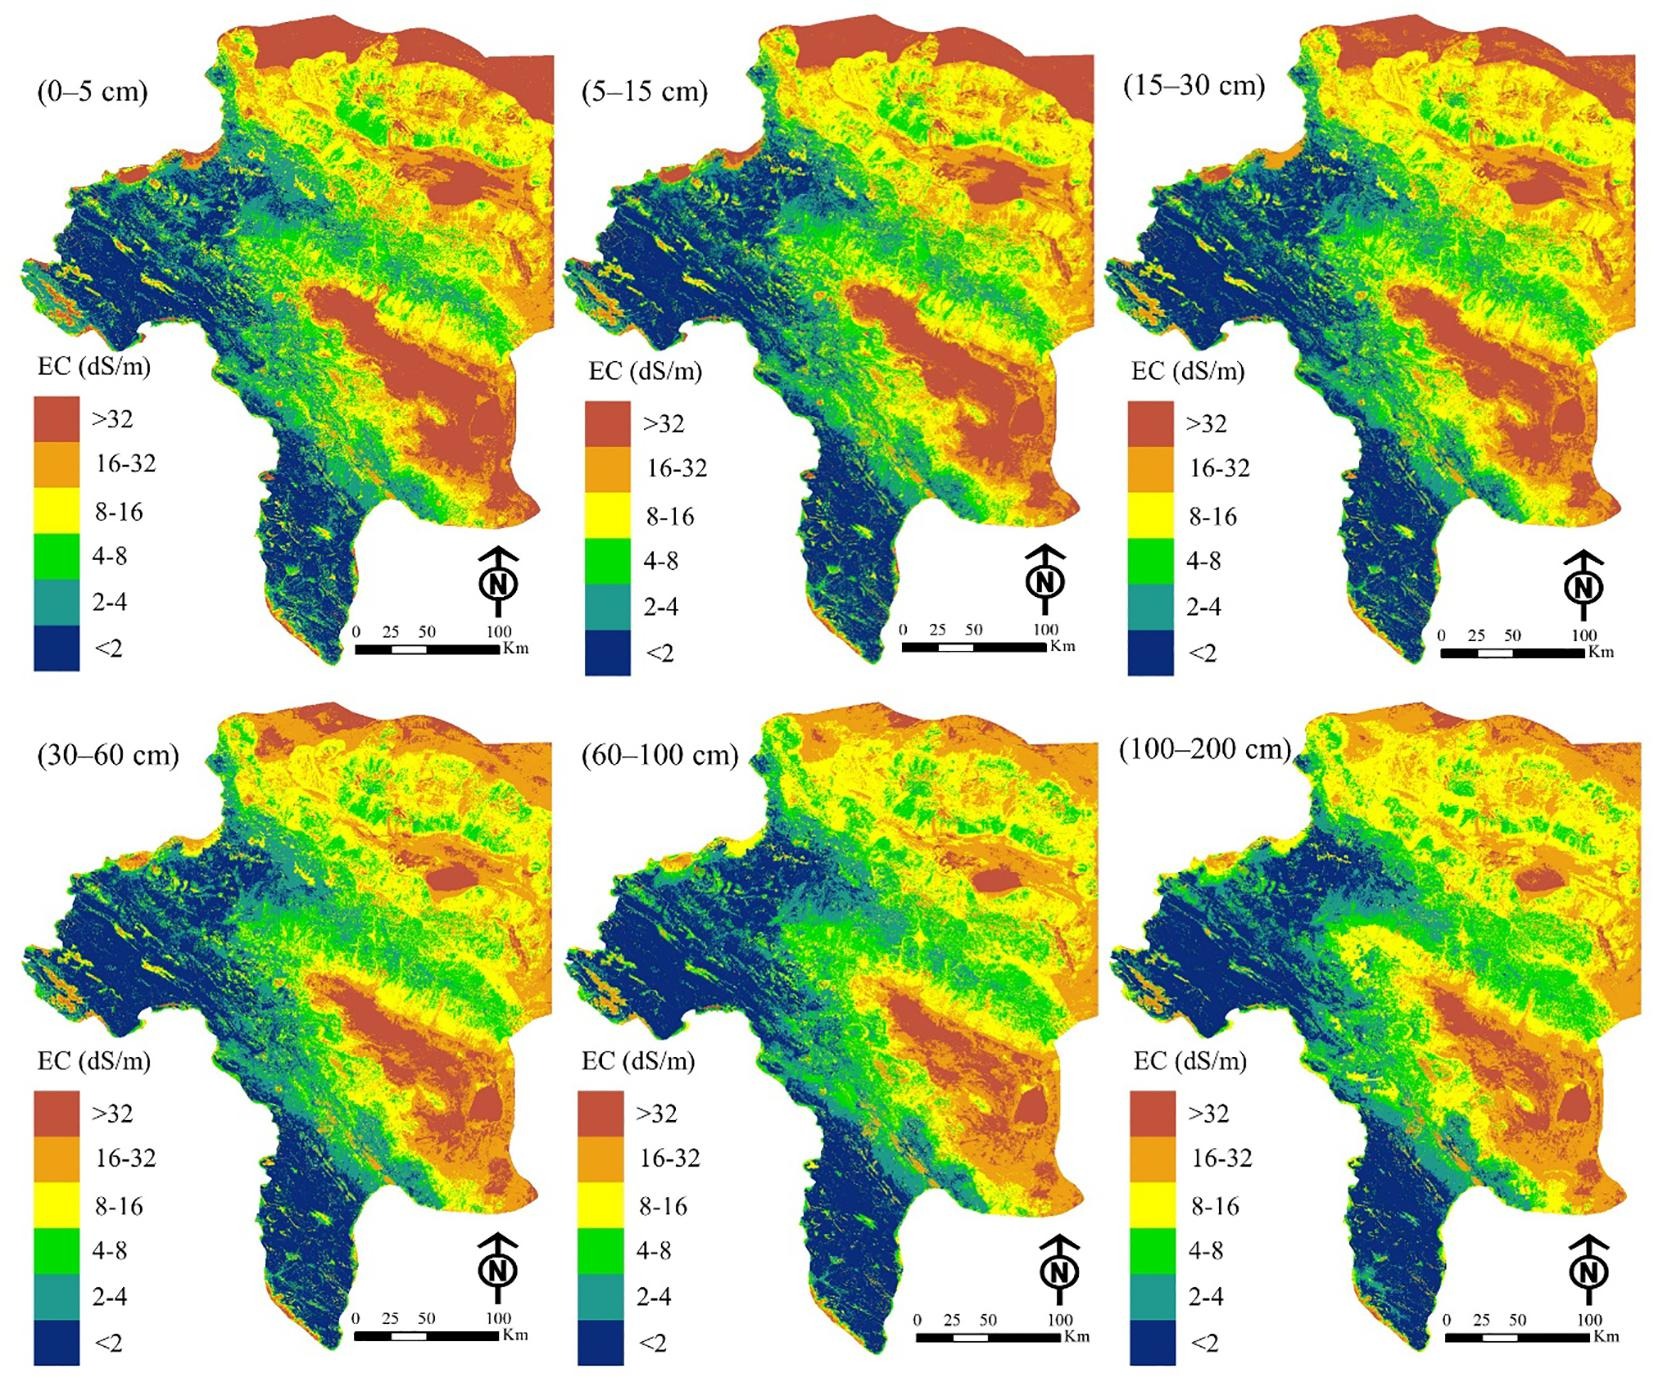
The spatial distribution of soil salinity at the six soil depth increments using W-SVR model are presented.
Conclusion
We implemented a ML algorithm using SVR with wavelet transformation of the covariates within a DSM framework to map and predict soil salinity in central Iran. Here, using a soil database and a full suite of covariates— derived from remote sensing data, terrain attributes, and climatic data—SVR and W-SVR models were built for each of the standard soil depth increments (i.e. for 0–15, 15–30, 30–60, 60–100 and 100–200 cm). Furthermore, we quantified the uncertainty of ML algorithms using UNEEC method. Our results indicated a higher performance of W-SVR in predicting soil salinity in comparison to SVR. This was most effective at the lower soil depths. This indicates a high potential of W-SVR for predicting soil salinity at the subsoil, where it is typically more difficult for ML models to predict.
Ruhollah Taghizadeh
Postdoc Researcher
My research interests include soil mapping, data science, and machine learning