Land Suitability Assessment
Land Suitability Assessment and Agricultural Production Sustainability Using Machine Learning Models
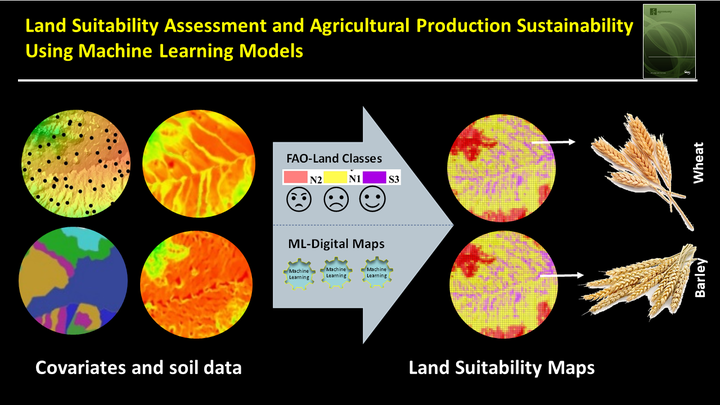
Table of Contents
Video Abstract
Motivation
Although Kurdistan province is one of the main agriculturally productive regions of Iran and holds an important role in the country’s crop production rank, the mean yield of rain-fed wheat and barley in these regions is lower than 800 kg ha−1 . Land suitability maps can classify the areas that are highly suitable for the cultivation of the two main crops and can help to increase their production. However, such information is commonly scarce in these semi-arid regions. Therefore, the main objective of this study is to assess the land suitability for two main crops based on the FAO “land suitability assessment framework”. Furthermore, in this study, we focus on using machine learning models to predict the spatial distribution of land suitability classes in the most economically feasible way and explore if it works better than the traditional approach.
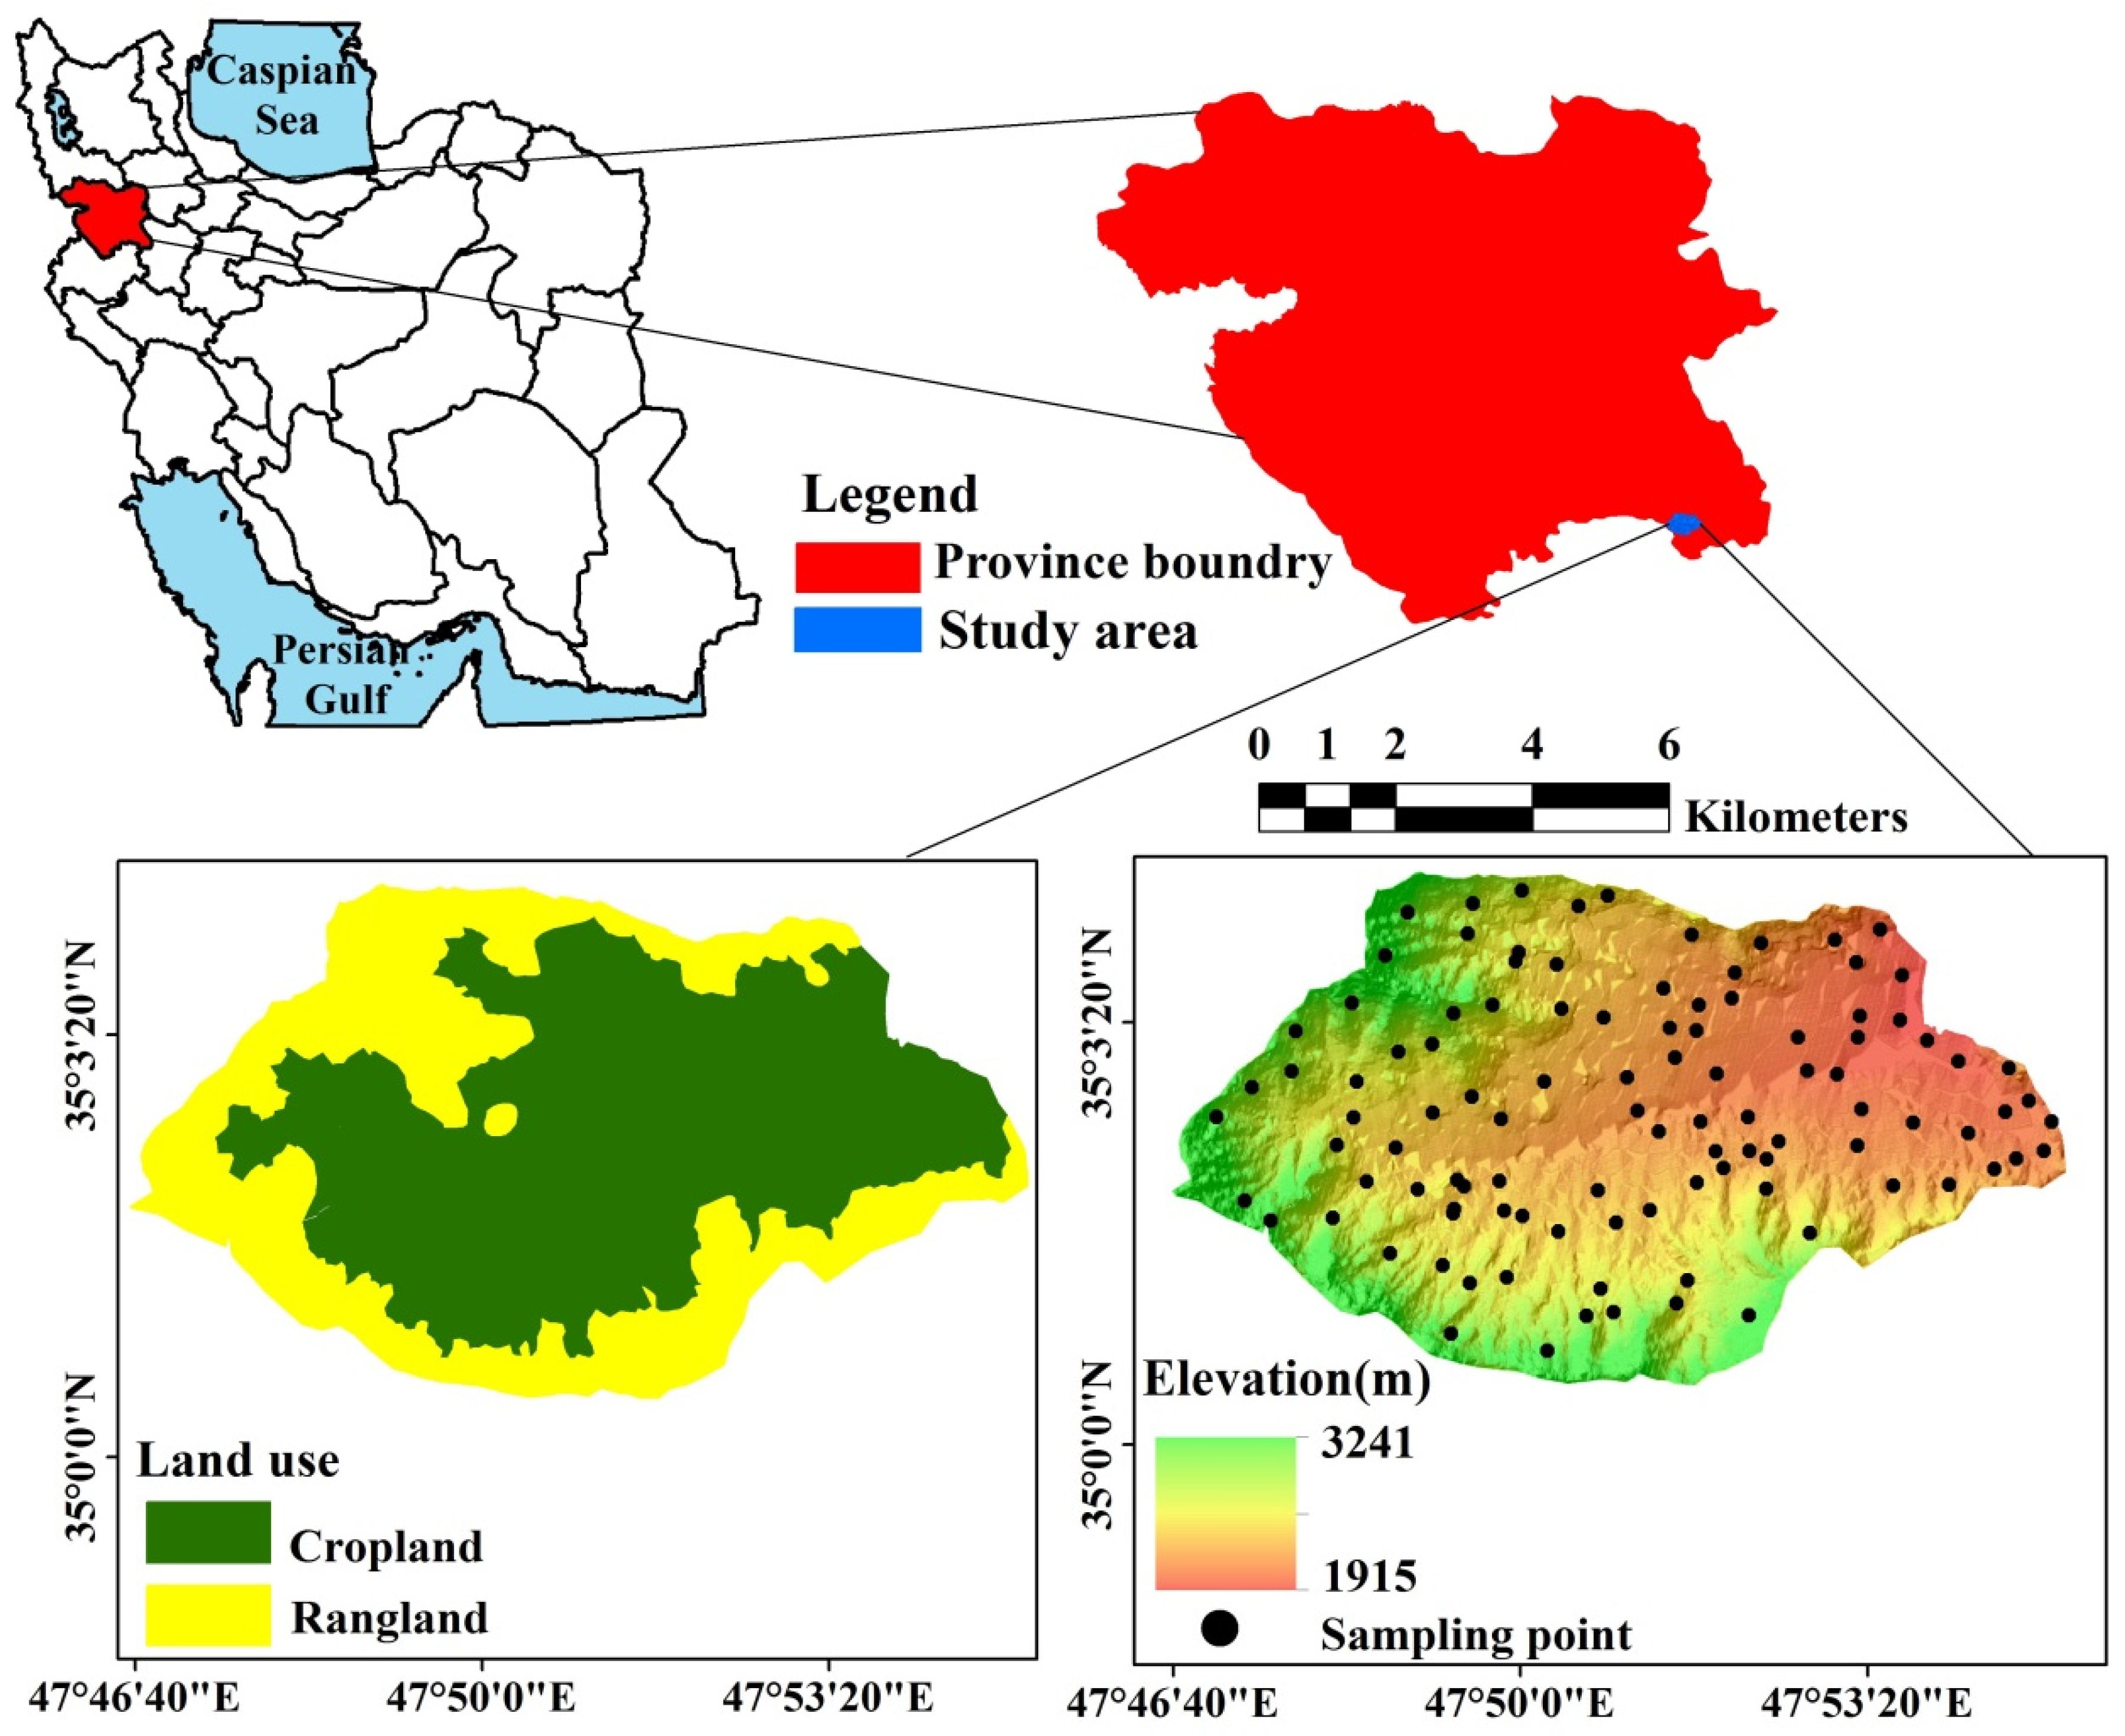
Study area
The study area is located in Kurdistan province, western Iran. It surrounds the city of Ghorveh and covers a region of 65 km2. The climate is semi-arid with a cold and rainy winter and a moderate and dry summer. The mean yearly rainfall is 369.8 mm and over 90% of the rain falls between November and March.
Methods
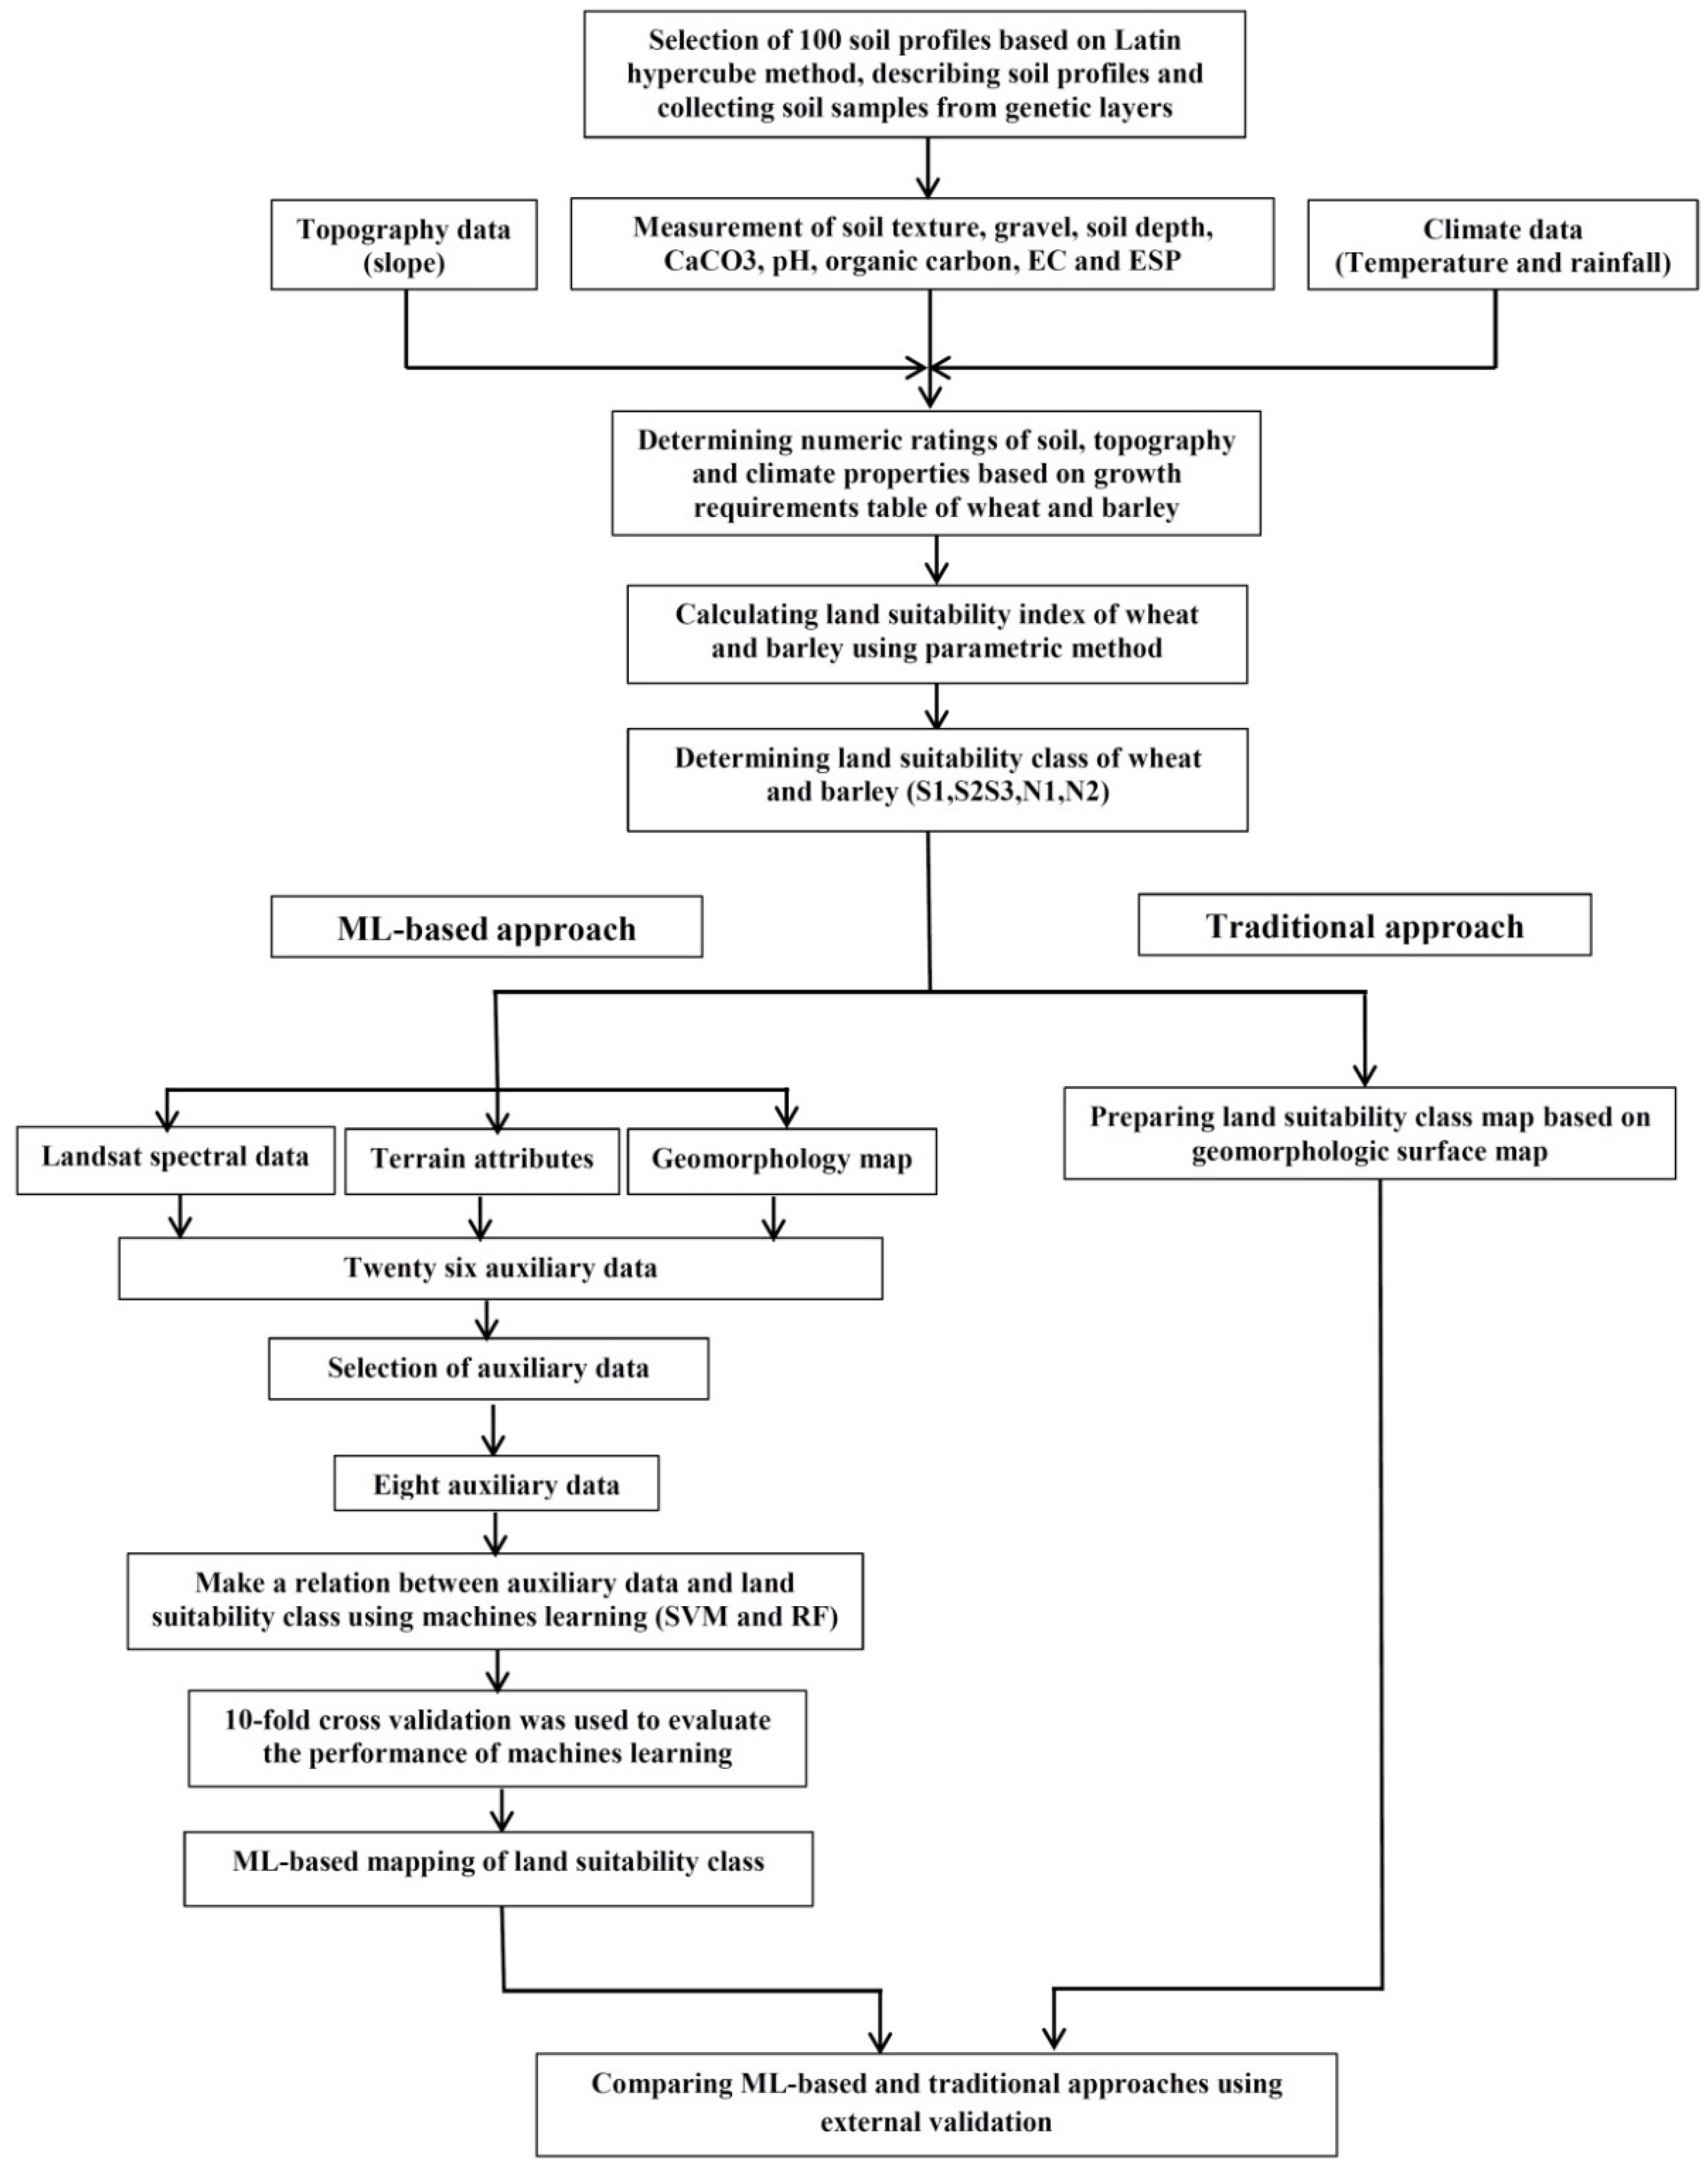
The workflow used to carry out this study is summarized in the figure.
Land Suitability Assessment
In this study a qualitative assessment of land was performed to determine land suitability classes for rain-fed wheat and barley. The selection of influencing factors was done based on the growth requirement tables for rain-fed wheat and barley.
Maps of Land Suitability Class
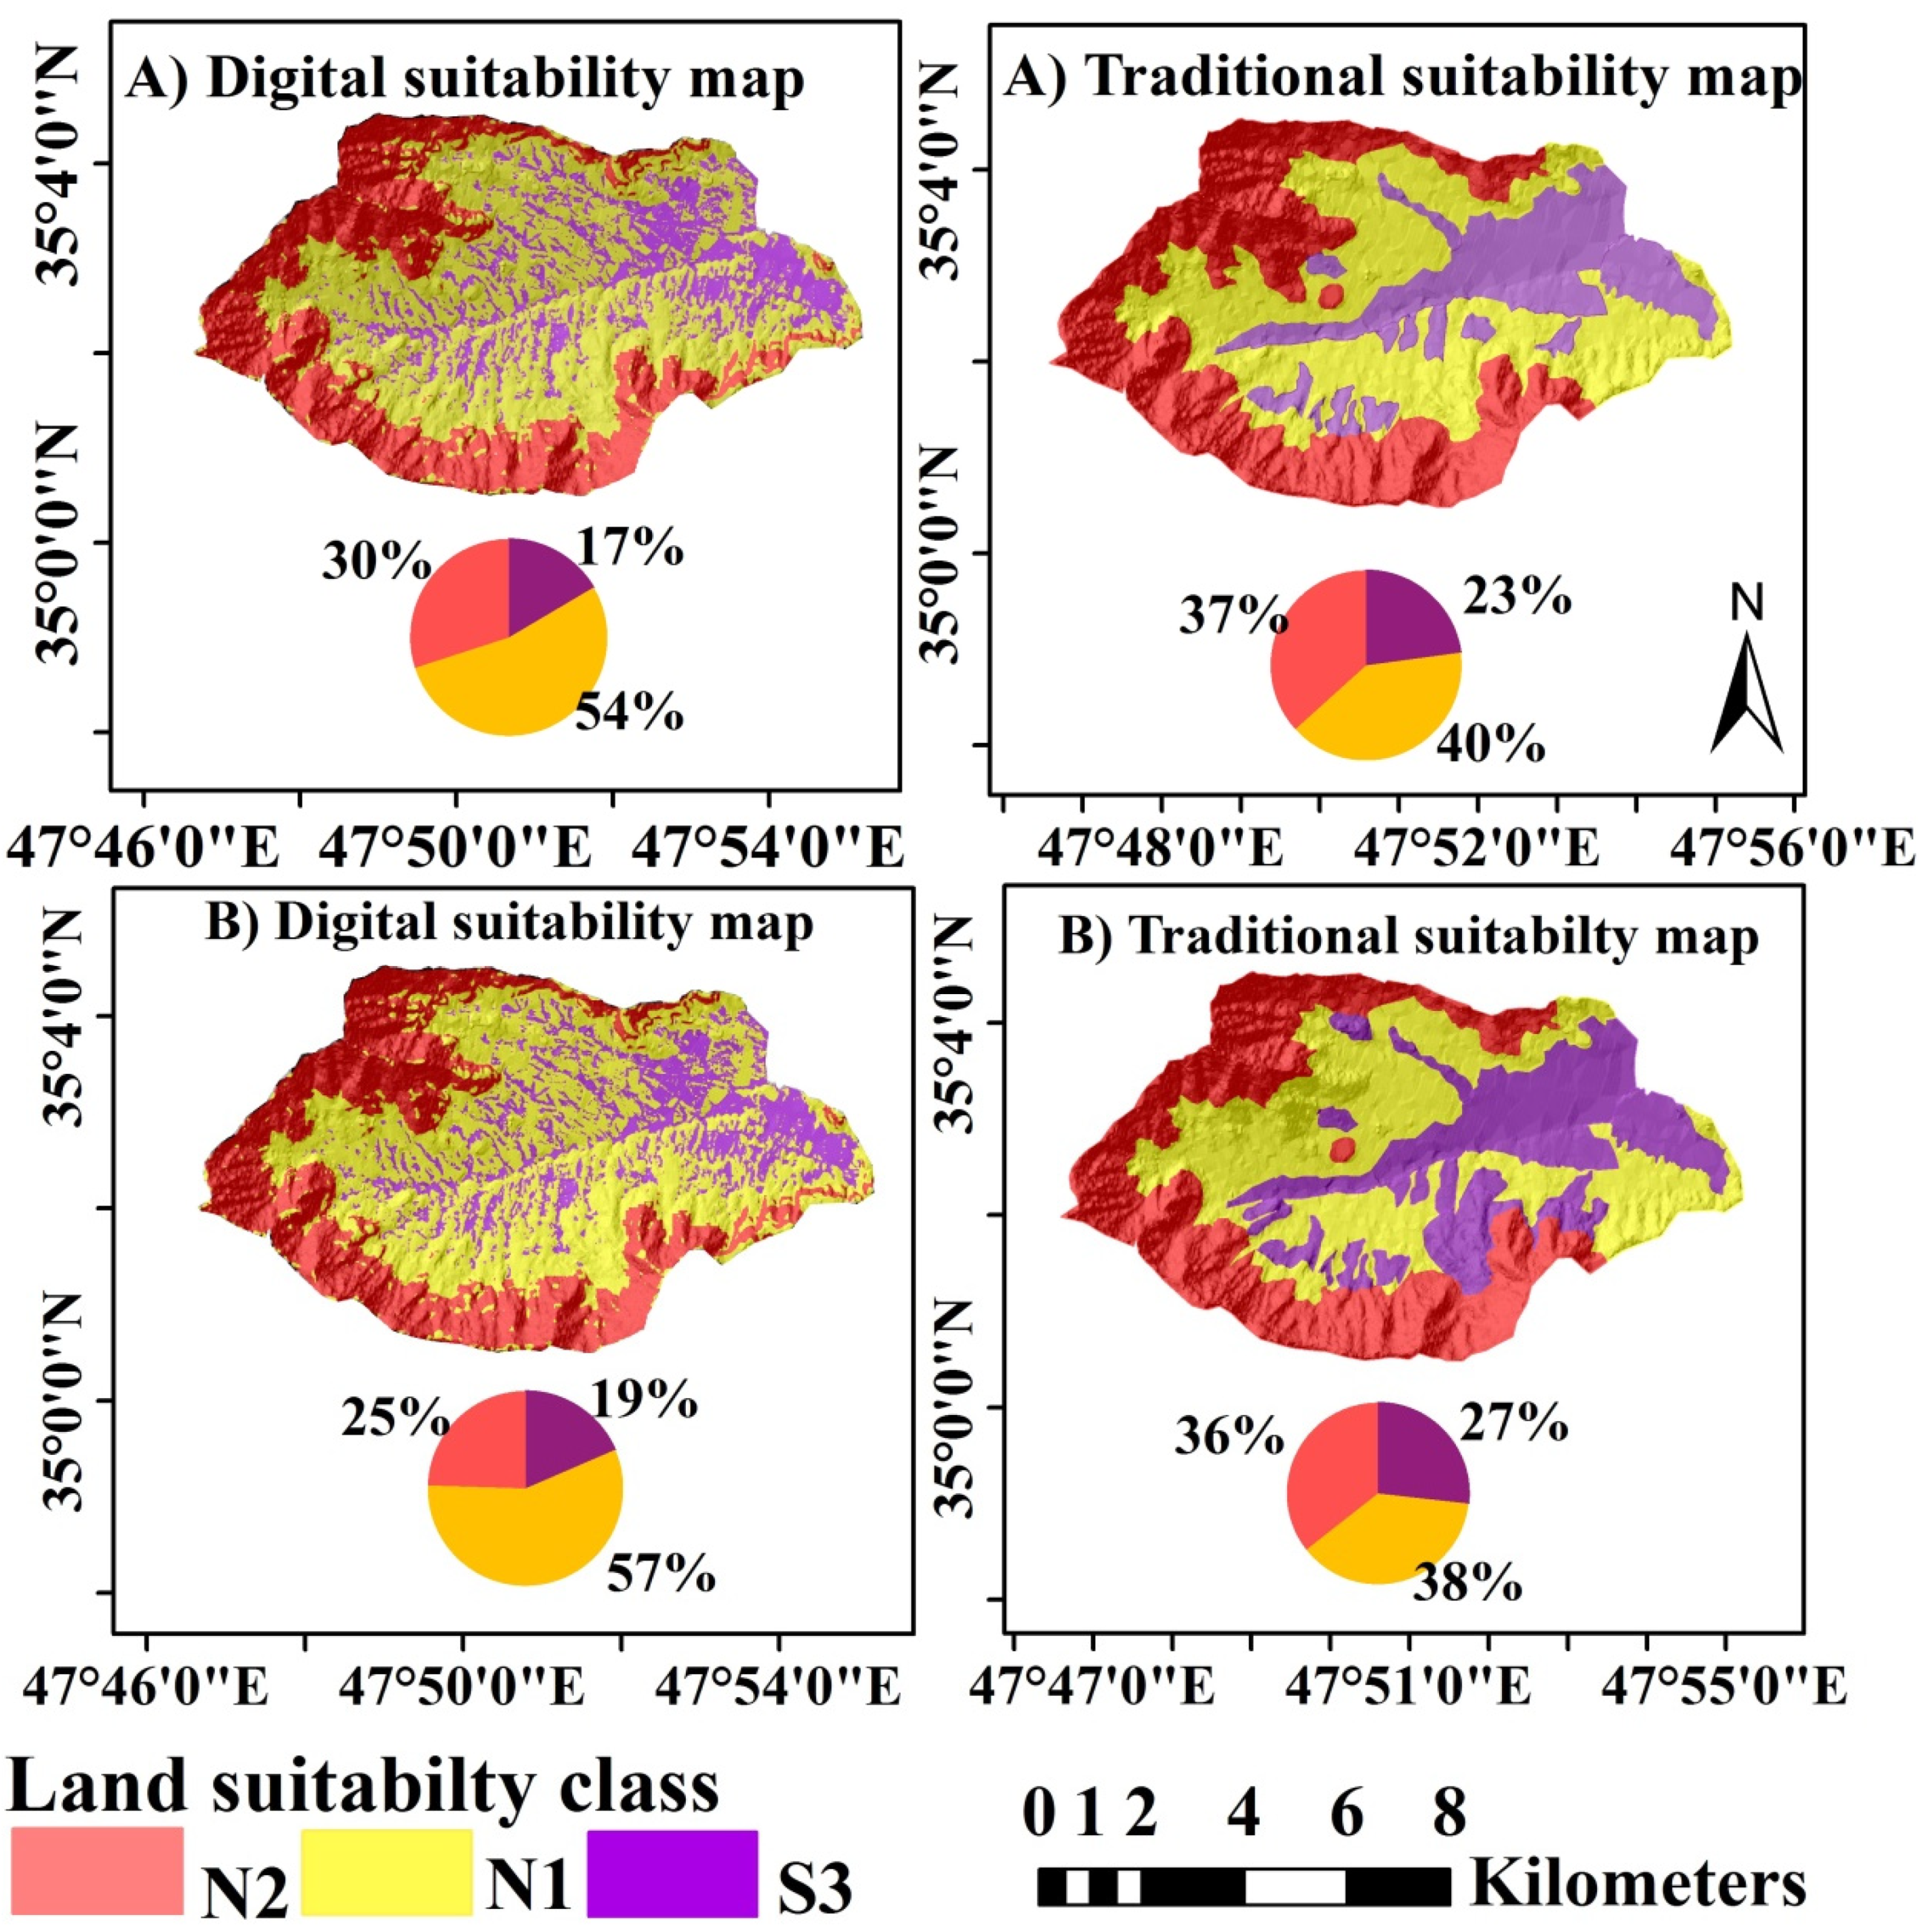
To prepare a map of land suitability classes across the study area, we implemented two approaches. In the first approach, the maps were prepared using ML models and auxiliary variables. In the second approach, the maps were prepared according the traditional approach, which is the most common approach to produce land suitability class maps in Iran.
Soil Development
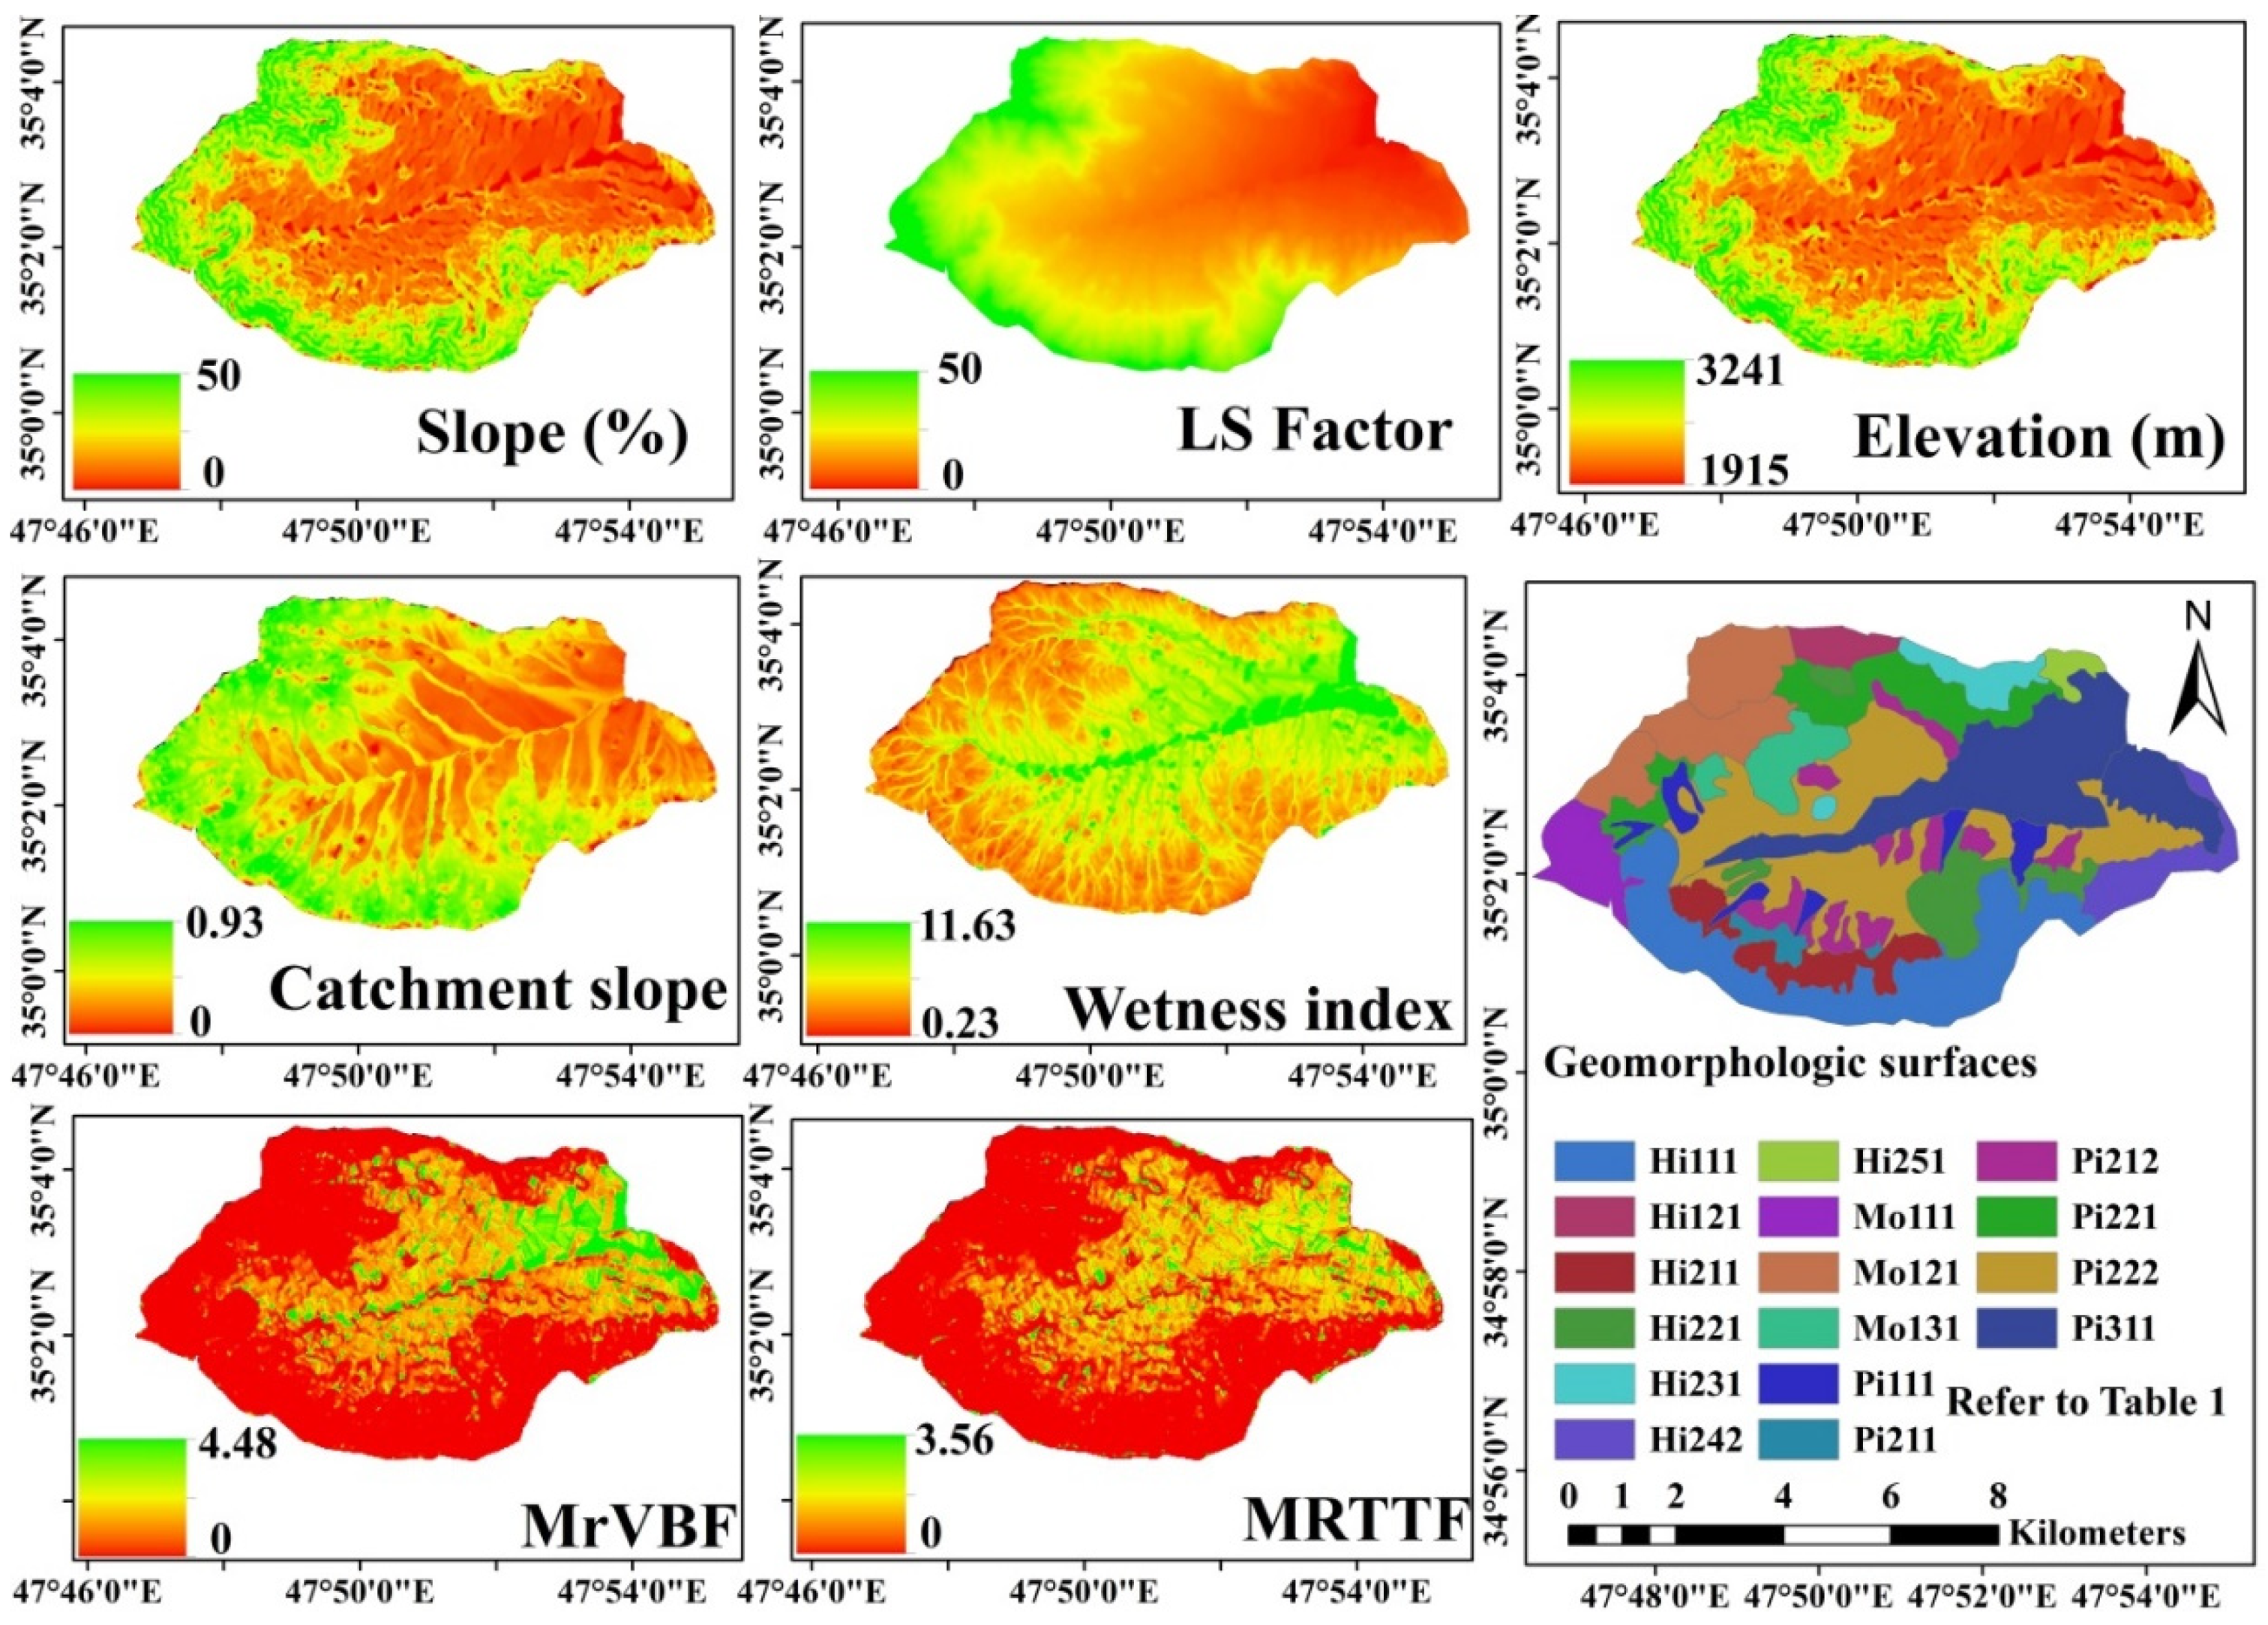
Geomorphological conditions of the study area have the greatest effect on many soil characteristics such as soil depth, soil texture, organic matter, drainage, gravel content, and accumulated calcium carbonate in the soil horizons; and different geomorphic surfaces have affected the development and evolution of soils. The diagnostic surface (ochric) and subsurface horizons (cambic and calcic) are the distinguishing features of the studied soils. The most important soil forming processes are the movement and leaching of calcium carbonate in the soil profile; and the accumulation of organic matter in the surface horizons. The soil profiles were allocated into two orders (i.e., Inceptisols and Entisols), two suborders (i.e., Xerepts and Orthents), three great groups (Haploxerepts, Calcixerepts, and Xerorthents), four subgroups (i.e., Typic Haploxerepts, Typic Calcixerepts, Typic Xerorthents, and Lithic Xerorthents), and seven families (fine loamy, mixed, active, mesic, Litic Xerorthent; loamy skeletal, mixed, superactive, mesic, Typic Calcixerept; loamy skeletal, mixed, superactive, mesic, Typic Haploxerept; sandy skeletal, mixed, mesic, active, Lithic Xerorthent; fine loamy, mixed, superactive, mesic, Typic Calcixerept; loamy skeletal, mixed, superactive, mesic, Typic Xerorthent; fine loamy, mixed, superactive, mesic, Typic Xerorthent). The soils formed in mountain and hill landscapes are Entisols; the reason for this is the high slopes and the lack of stability of the geomorphic surfaces. In contrast, the soils formed in the piedmont landscape are Inceptisols with a dominant calcification process.
Selected Auxiliary Variables
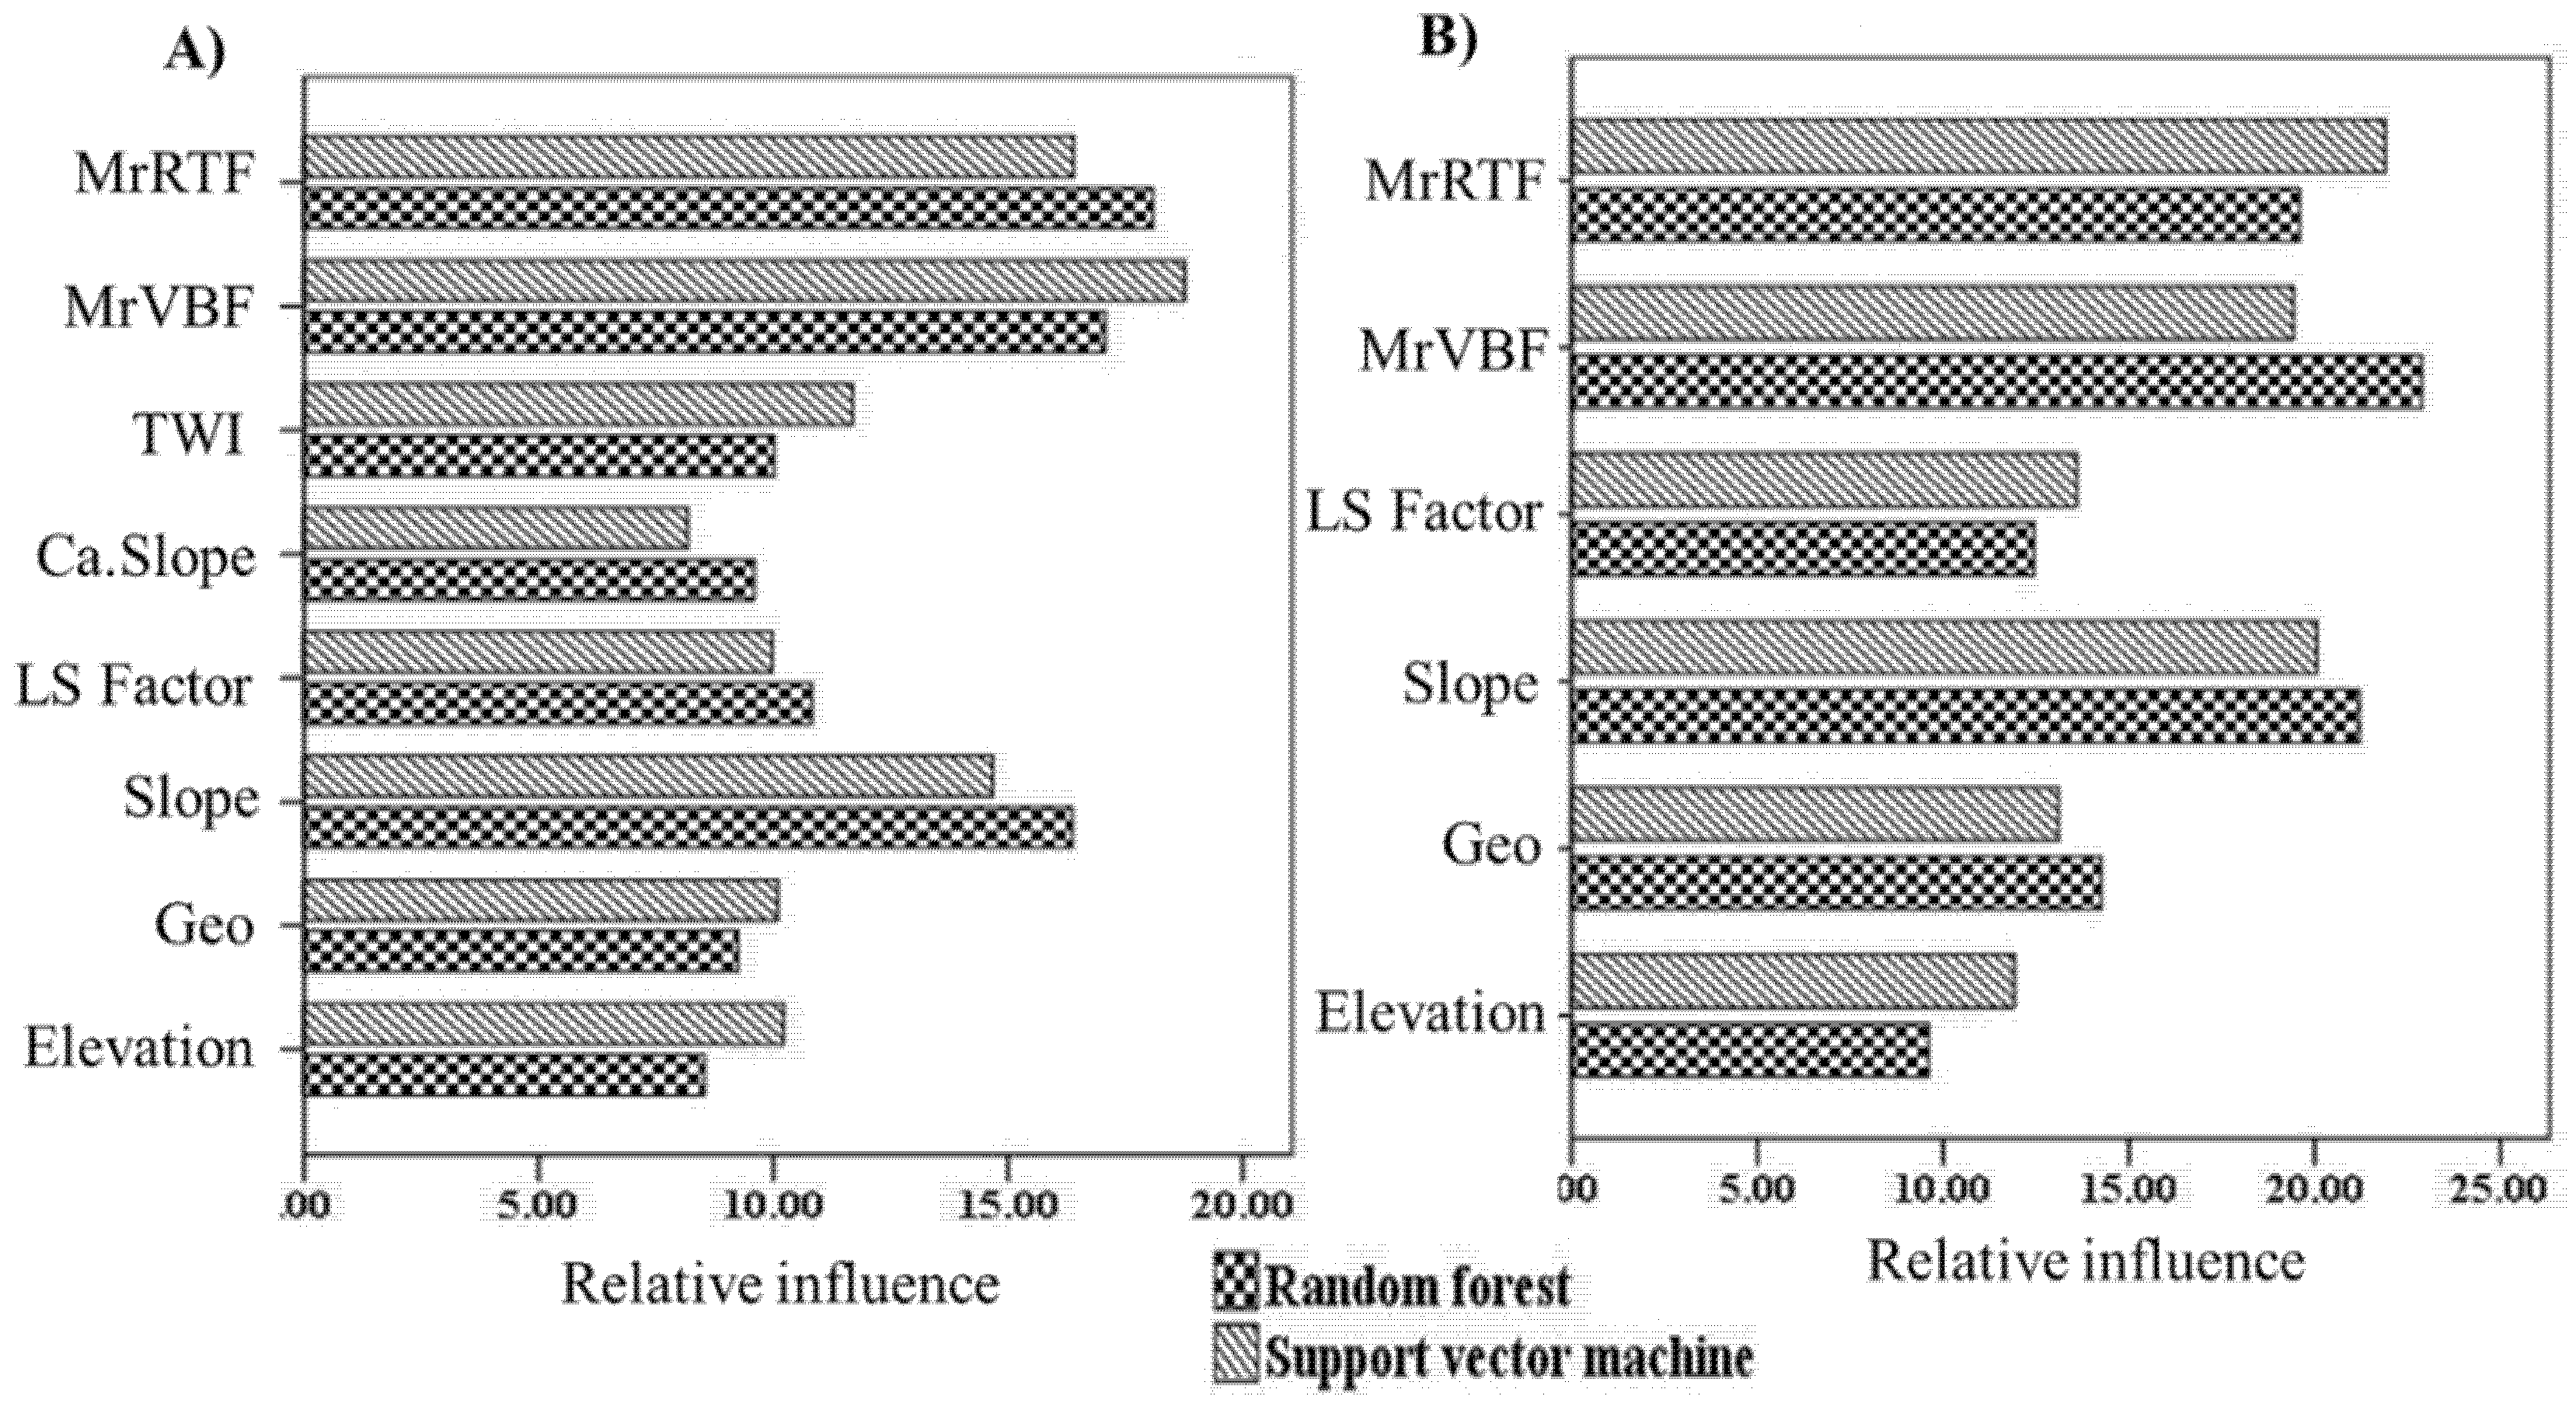
Figure shows the relative influence of each auxiliary variable used in the modeling and prediction of land suitability classes. The relative influence of each auxiliary variable within the modelling was calculated in the RF model according to the mean decrease in impurity (or gini importance) mechanism, while in the SVM model the weights reflect the importance of the auxiliary data.
Comparing Traditional and ML-Based Approaches
The ML-based land suitability maps for rain-fed wheat and barley had higher kappa index values and overall accuracy (0.77 and 0.79; 0.69 and 0.73, respectively) compared to traditional land suitability maps (0.45 and 0.50; 0.43 and 0.47, respectively).
Conclusion
This study assessed land suitability for rain-fed wheat and barley on agricultural land in Kurdistan province, Iran. This was done using the FAO land suitability assessment framework, parametric method, and two mapping approaches namely ML-based and traditional methods. The MrRTF, MrVBF, slope, LS factor, TWI, catchment slope, elevation, and geomorphology map were the most important auxiliary data for predicting land suitability class of rain-fed wheat and barley. Based on kappa index results, RF was the better ML model for predicting land suitability class of rain-fed wheat and barley compared to the SVM approach. RF has several advantages over other statistical modeling approaches and is considered a powerful modeling technique for predicting land suitability classes. Comparison between traditional and ML-based approaches also showed that the ML-based approach identified larger areas of N2 and S3 classes and smaller areas of the N1 class than the traditional approach.
Ruhollah Taghizadeh
Postdoc Researcher
My research interests include soil mapping, data science, and machine learning